AWS I4i Instances Provide Superior Performance for Aerospike
AWS has announced the availability of I4i instances based on the 3rd Generation of Intel® Xeon® Scalable (code name Ice Lake) processors. After running a number of benchmarks described in this blog, Aerospike recommends I4i as an attractive alternative to I3/I3en instances, which are based on Xeon® Scalable 1st and 2nd Generation processors. In many cases, particularly applications with high storage and CPU requirements, I4i will be the best choice.
Instance Comparison
The predominant deployment pattern for Aerospike workloads on AWS utilizes the Hybrid Memory Architecture (HMA) configuration. Under HMA, records are stored on Local SSD, while the index is stored in DRAM. Historically, I3en instances have been very cost-effective for Aerospike cluster nodes, owing to the large amount of storage per instance available, backed up by a high core count, DRAM, and network bandwidth.
Metric | I4i | I3en | I3 |
vCPU | 2-128 | 2-96 | 2-72 |
DRAM | 16-1024 GiB | 16-768 GiB | 15-510 GiB |
Local SSD | 1×468 – 8×3750 GB | 1×1250 – 8×7500 GB | 1×475 – 8×1900 GB |
Network Bandwidth | 10-75 Gbps | 25-100 Gbps | 10-25 Gbps |
Turbo Frequency | 3.5 GHz | 3.1 GHz | 3.0 GHz |
Processor Family | Xeon Scalable 3 | Xeon Scalable 1 & 2 | Broadwell |
On-Demand Cost | $0.172 – $10.892/hr | $0.226 – $10.848/hr | $0.156 – $10.848/hr |
Table 1: I4i vs I3/I3en
As can be seen in Table 1, I4i instances offer greater turbo performance and 1.5-2x more DRAM compared to I3 and I3n, while supporting storage-dense configurations of up to 30TB. Also note the cost is roughly the same across all instance families, but the cheapest I3 instances cost the least.
Aerospike elected to test the performance of I4i.32xlarge against i3en.24xlarge instances. These are the largest non-metal instances of their respective families. Their cost is nearly identical ($10.89/hr vs $10.84/hr), so any differences in performance should correspond closely to differences in cost.
To assess performance, we ran two sets of comparisons: 1) Local SSD performance using single nodes with the Aerospike Certification Test (ACT) program; 2) 3-node cluster tests driven by Aerospike benchmark clients.
ACT Tests
ACT is an open-source standalone program that simulates the IOPS pattern generated by a cluster node that is being driven by the user’s application. This includes behind-the-scenes operations such as block compaction. Because of this, ACT yields more accurate results than a simple load generator like the Linux fio utility.
ACT is launched with an IOPS target, and is required to run 24 hours to succeed. During this time, if ACT falls more than 10 seconds behind, the run will be aborted with an error. There are also latency constraints: no more than 5% of the operations can exceed 1 millisecond in duration. To obtain results, multiple iterations of ACT tests were run on each instance, varying the service threads and disk partitioning until the maximum throughput with acceptable latency was achieved. Table 2 shows the results for comparing I4i.32xl to I3en.24xl.
Metric | I4i.32xl | I3en.24xl | Improvement |
IOPS/sec (x-rating) | 192,000(64x) | 162,000(54x) | 18% |
P(95) Latency | <1 ms | <1 ms | n/a |
Table 2: ACT Results
For throughput, both raw IOPS and the “x-rating” are listed. The latter is an indicator of normalized per drive performance. Assuming a 2:1 read:write ratio, the x-rating is calculated by the following formula:

The results demonstrate that I4i.32xl instances achieved 18% higher single-SSD throughput compared with i3en.24xl (the previous record-holder).
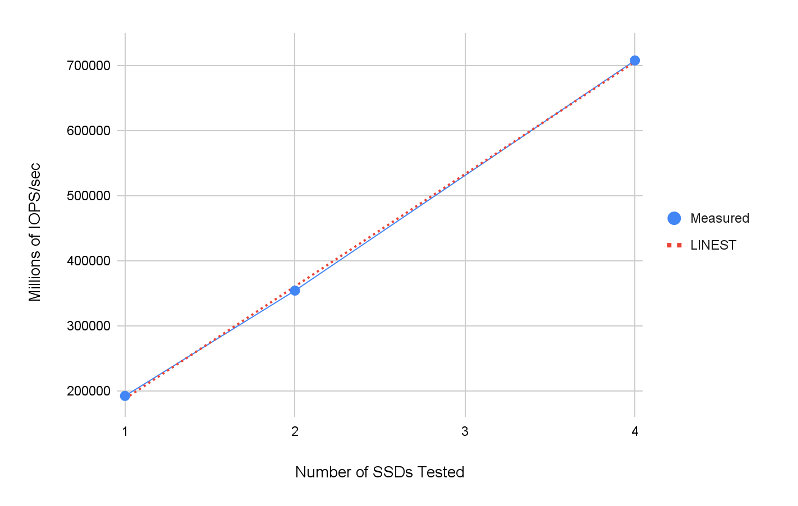
We also used ACT to assess SSD linearity: whether IOPS scales as the number of SSDs is increased. Three ACT runs were made with 1, 2, and 4 SSD, configured as shown in Table 3.
Metrics | Single SSD | 2 SSDs | 4 SSDs |
| nvme1n1p[1-4] | nvme1n1 nvme2n1 | nvme1n1p[1-4]– nvme4n1p[1-4] |
| 4 | 2 | 16 |
| 1536 | 1536 | 1536 |
| 2:1 | 2:1 | 2:1 |
| 64 | 128 | 256 |
| 1 | 1 | 1 |
IOPS/sec (X-rating) | 192,000 (64x) | 354,000 (59x) | 708,000 (59x) |
P(95) latency | <1 ms | <1 ms | <1 ms |
P(99) latency | <2 ms | <2 ms | <2 ms |
Table 3: Linearity Test Parameters & Results
1When SSDs are partitioned, each partition counts as a block device.
Test results are plotted graphically in Table 1 below. Throughput is shown by the blue dots, and the dashed red line is a least-squares fit using the LINEST function. The computed line has a coefficient of determination of 0.99954 (where perfect linearity would be 1.0).

Figure 1: Aerospike Certification Test Linearity
3-node Cluster Tests
These tests were based on 3-node clusters of I4i.32xlarge and i3en.24xlarge instances. These clusters were driven by 8 C5n.9xlarge client instances, each of which ran 3 copies of the Aerospike Java Benchmark tool (24 total). The benchmark tool was configured to generate CRUD transactions at a specified rate, read-write ratio, and record size. Tests were performed with the replication factor set to 1. Record sizes of 512 and 1536 were used, and read:write ratios of 1:0 (read-only) and 1:1 (balanced). The cluster configurations are shown in Table 4.
Metric | I4i.32xlarge | I3en.24xlarge |
vCPU | 128 | 96 |
Cluster Nodes | 3 | 3 |
DRAM | 1024 GiB | 768 GiB |
Instance Storage | 8 x 3750 GB | 8 x 7500 GB |
On-Demand Cost | $10.892/hr | $10.848/hr |
Table 4: Test Cluster Configuration
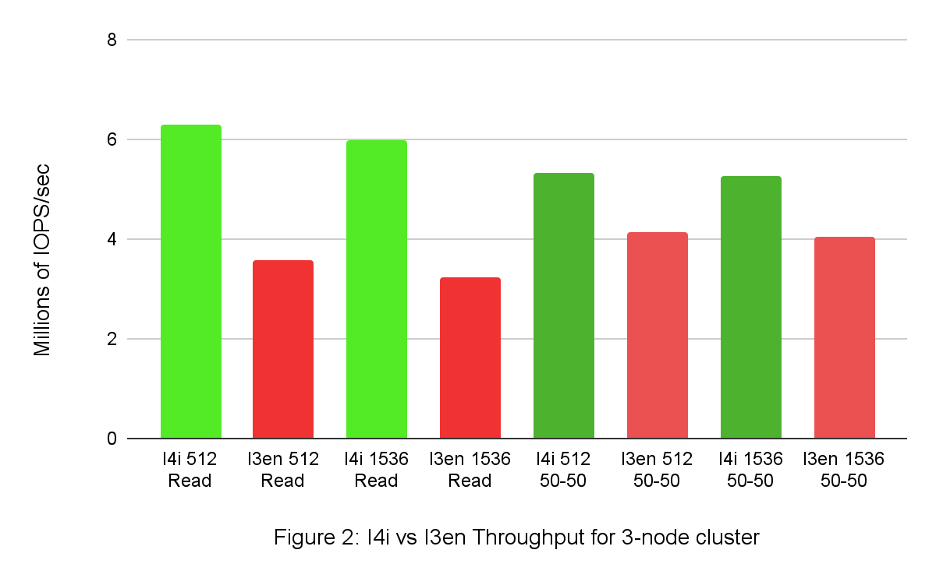
Table 5 shows the throughput for an HMA cluster (data stored in local SSD).
Throughput (Millions of IOPS/sec) | |||||
512-byte Records | 1536-byte Records | ||||
Instance | Nodes | Read-Only | 50-50 read/write | Read-Only | 50-50 read/write |
I4i.32xl | 1 | 1.71 | 1.78 | 1.71 | 1.88 |
I3en.24xl | 1 | 1.09 | 1.42 | 1.21 | 1.38 |
Improvement | 56% | 25% | 42% | 36% | |
I4i.32xl | 3 | 6.30 | 5.34 | 5.07 | 5.28 |
I3en.24xl | 3 | 3.57 | 4.14 | 3.24 | 4.05 |
Improvement | 76% | 28% | 56% | 30% |
Table 5: HMA Cluster IOPS
This can be seen graphically in the following chart:

For all these runs, latency was very low. For the I4i.32xl test we measured a P(99) value of well under 1 millisecond, meaning that over 99% percent of the transactions completed in that amount of time.
Discussion
There is considerable variation among database applications in terms of the resources they utilize. Applications that primarily read and write records will be I/O-bound. Applications using more advanced Aerospike features such as aggregations, Expressions, or compression require significantly more computing power or DRAM. The availability of AWS I4i instances affords the ability to develop cost-effective configurations at scale across a wider range of applications. This does not eliminate the need for prototyping on a smaller scale, but it does suggest a rough decision tree for determining which instances are most appropriate:
I4i for applications requiring more CPU cores or DRAM while supporting high density SSD storage (up to 30TB/instance) and network bandwidth (75GBE)
I3en for applications requiring the maximum storage density (up to 60TB/instance) and network bandwidth (100 GBE).
I3 for cost-sensitive applications with modest CPU, DRAM, and network requirements.
Further Reading


