
Observability is essential to understanding your systems architecture and establishing your operational workflows. With proper observability, developers and database operators can monitor latency objectives, understand infrastructure utilization, configure alerting, and more. This post will describe the primary components of the Aerospike Observability Stack and provide you with some examples to help you explore the system on your own.
Aerospike Instrumentation & Metric Exporter
The starting point for observability is instrumentation. Aerospike was built for performance by carefully instrumenting all aspects of the product – this is done at the database level itself, and each of these metrics can be monitored directly with specific commands. The Aerospike metric reference provides examples of these commands and is an essential companion when working with the Aerospike Observability Stack.
The Aerospike Exporter makes Aerospike metrics available in the Prometheus, Open Telemetry format, making it easy to integrate with a wide variety of monitoring solutions. In order to expose these metrics to the monitoring stack, each node of the Aerospike cluster(s) must have the Exporter installed. This post includes examples that use Prometheus and Grafana, but you can find several examples of integrating with partner solutions here.
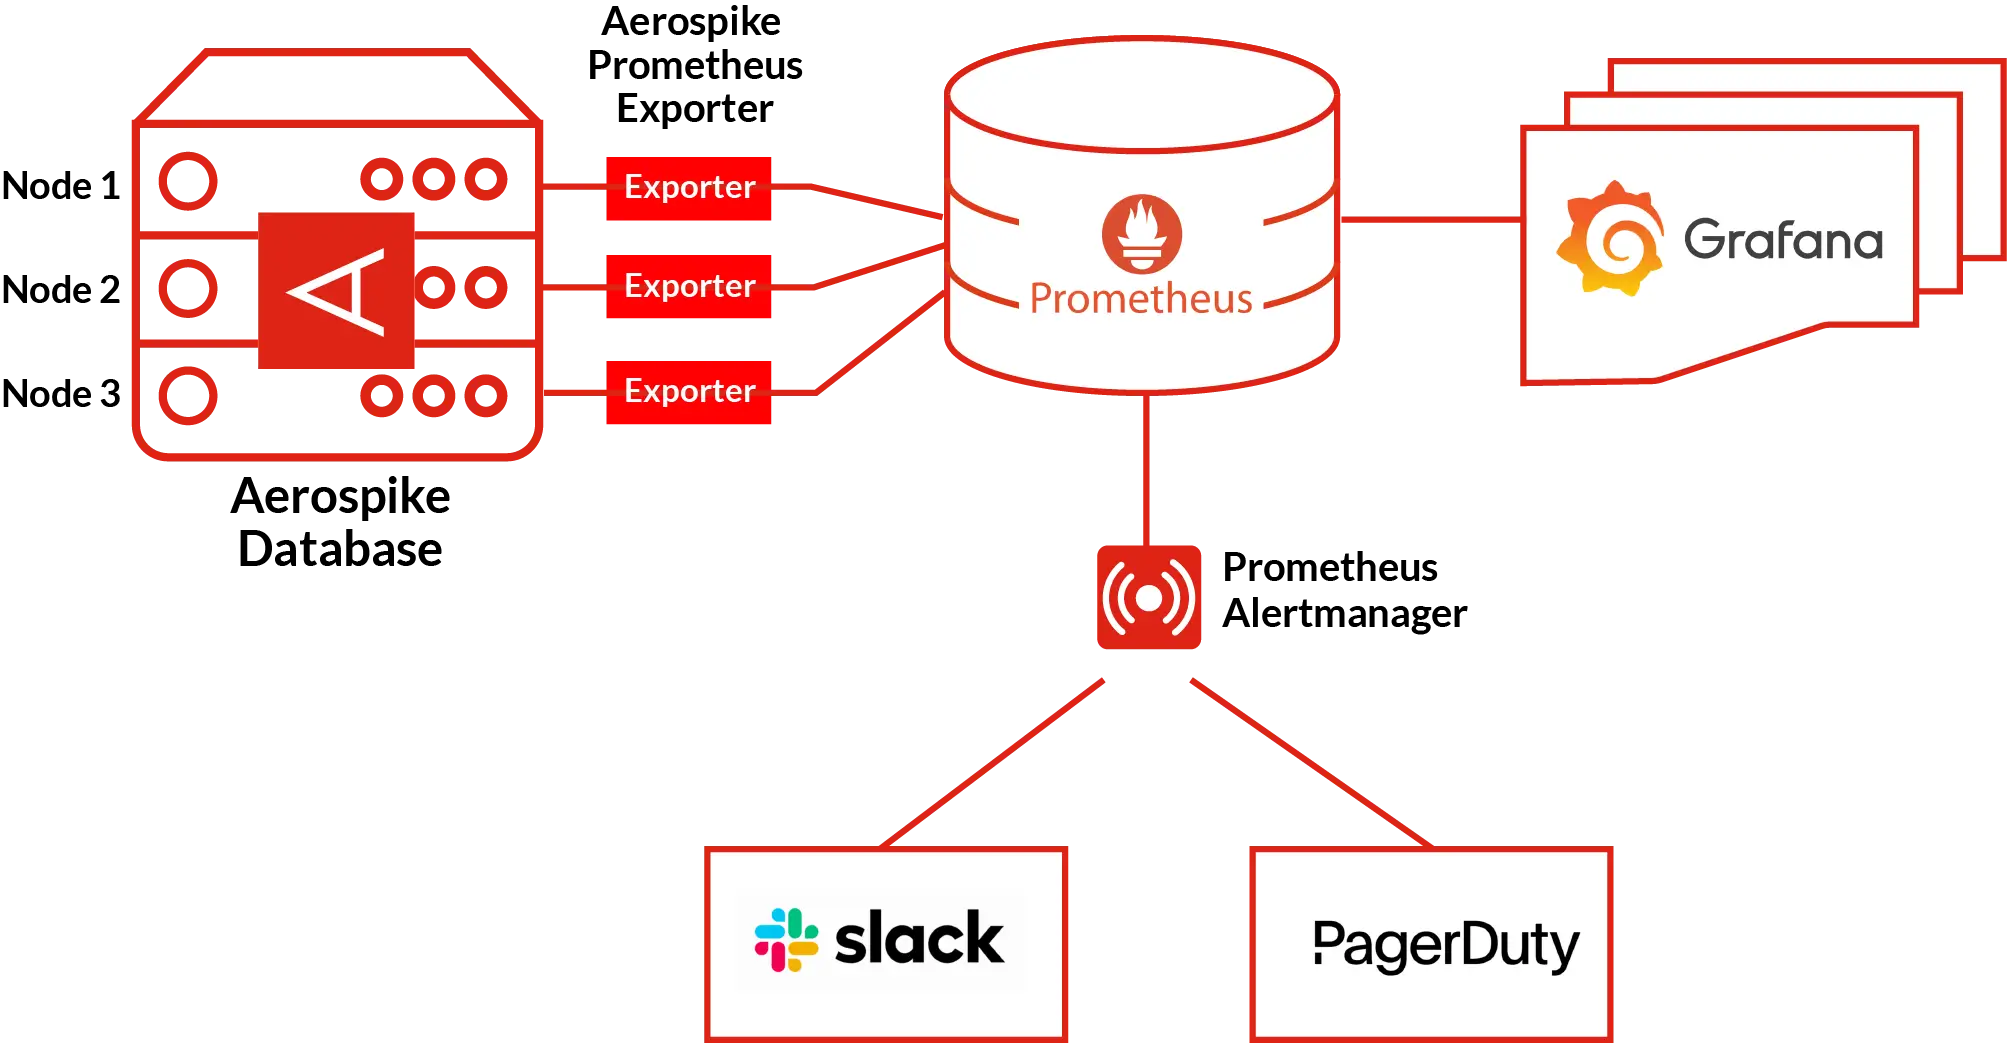
Figure 1: Metric Exporters on each Aerospike node populate the Prometheus server, which feeds Grafana dashboards and alerting capabilities.
Prometheus, Grafana, and Alertmanager
Prometheus and Grafana provide free open source tooling for monitoring, alerting, and dashboards and form the Aerospike Observability Stack.
Prometheus TSDB – The Prometheus time series database provides storage of your Aerospike metrics, outside of your Aerospike cluster. Prometheus has a time series-specific query language, known as PromQL, which enables robust charting and alerting capabilities.
Grafana – Grafana allows you to visualize Prometheus queries in dashboards. Aerospike has curated a set of dashboards around several meaningful and actionable use cases.
Prometheus Alertmanager – Prometheus Alertmanager processes alerting rules and integrates with popular communication and ticketing systems such Pager Duty, Slack, and ServiceNow. This allows you to be alerted to scenarios that might require attention without having to constantly check a dashboard. The Aerospike Observability stack includes a default set of alerting rules included with installation.
Together these components provide a comprehensive set of observability tools you can set up yourself.
Aerospike Dashboards
Prometheus, Grafana, and Alertmanager form the basis of a range of pre-built Aerospike dashboards. Many of these dashboards correspond to specific use cases, or jobs-to-be-done.
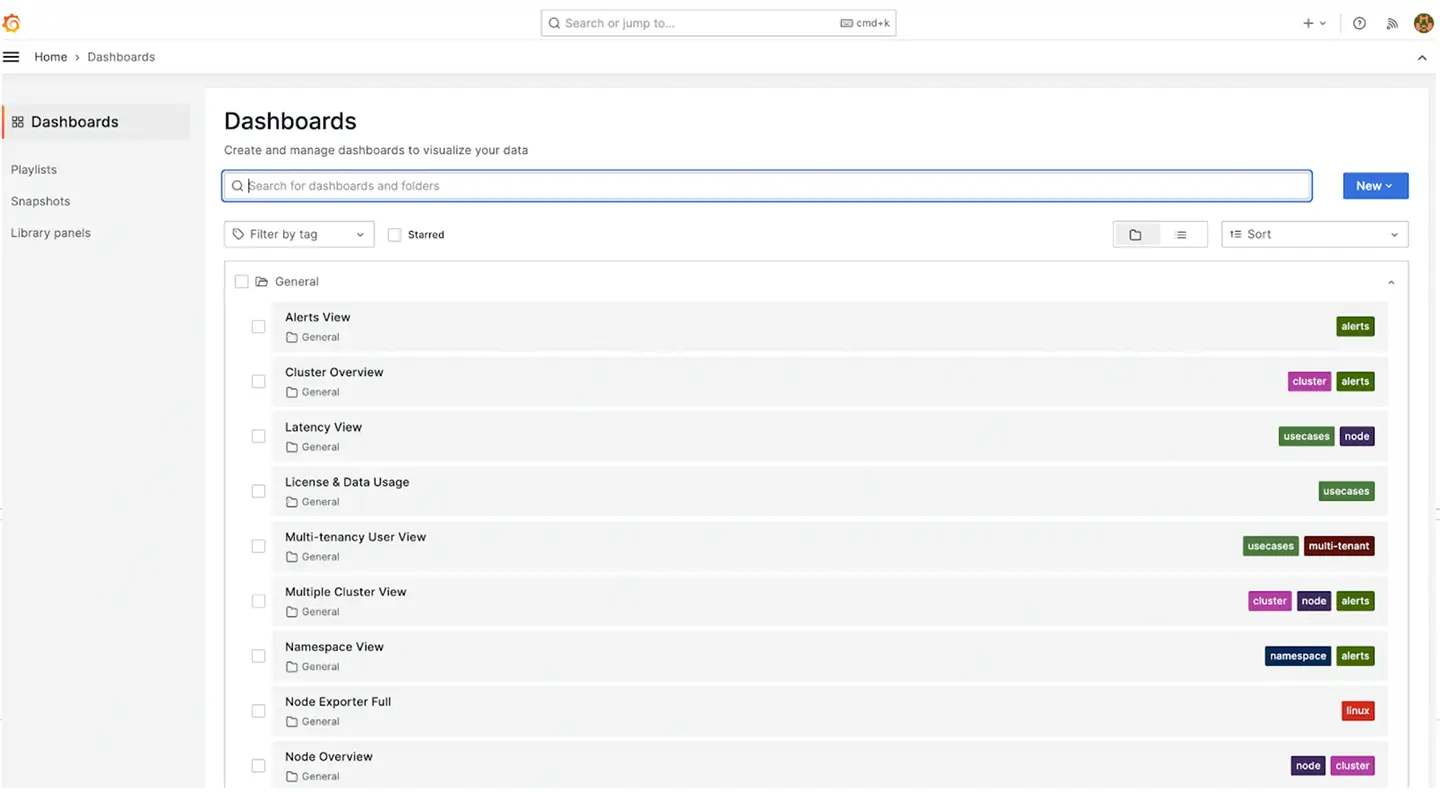
Figure 2: Portal to select and create dashboards.
Running Aerospike + Observability Stack
Now that we’re familiar with the primary components of the system, let’s try some examples for hands-on experience working with the Aerospike Observability Stack.
Example 1 – single node
In the first example, we’ll simply clone an existing monitoring stack and then deploy it along with an Aerospike cluster with Docker.
Use the short sample code below.
git clone https://github.com/aerospike/aerospike-monitoring.gitNext, simply change to the Docker examples folder, and run the following Docker Compose code.
cd aerospike-monitoring/examples/docker
docker compose up -d
This script triggers the following actions:
Deploys a single node Aerospike cluster
Attaches the Exporter
Deploy Prometheus, Alert Manager, and Grafana
Deploys Aerospike’s curated dashboard and alerts.
The observability stack is now installed and available. Simply open your browser to http://localhost:4000 to start exploring the dashboards and alerts in action.
Example 2 – multi-node
Running a single node Aerospike cluster doesn’t really showcase the capabilities of Aerospike, or the Observability Stack. While the single node example illustrates the basics, the Aerospike O&M stack is most powerful and effective for enterprises with large deployments. Operations teams that handle multiple/various microservices environments need enterprise O&M to stay aware of system health and quickly find the root sources of any issues. Customers with multiple large clusters, often distributed globally, particularly benefit from the new O&M stack
For this next example, we’ll configure a more advanced example with multiple clusters, security, and replication across geographies. Note, you’ll need an Aerospike license to proceed with this example as it takes advantage of Aerospike Enterprise features. You can sign up for a free trial.
To quickly navigate through this example, first download AeroLab, Aerospike’s tool for deploying and configuring Aerospike clusters. This can work locally using Docker, or in the cloud on GCP or AWS. Once you have AeroLab installed, run the following script:
cd aerospike-monitoring/examples/aerolab
./01-create.sh
The script does the following:
Creates two clusters – a three node active primary cluster, and a single node passive cluster.
Enables security and configures multiple users – this will showcase Aerospike’s muti-tenancy capabilities.
Connects the two clusters via Aerospike’s Cross Datacenter Replication (XDR – this will allow you to test XDR and see the value of observability across clusters.
Assigns latitude and longitude to each cluster – this will show the clusters on the map, one data center in North America and one in Europe
Installs required plugins in Grafana –
Once the script finishes, your environment is ready to explore.
It’s helpful to start a workload once you have finished the installation. To do this, run the following:
./02-load.shKeep reading

Jun 17, 2026
Fail fast, stay resilient: How to stop hidden gray failures in Aerospike on AWS EBS

May 28, 2026
Determining the best machine learning and AI databases

May 18, 2026
The three price tags: How Redis unpredictability costs you infrastructure, engineering time, and UX

May 12, 2026
Monitoring Aerospike Enterprise in Datadog: What you get and how it works