Blog
Troubleshoot smarter with Aerospike logs and metrics
Discover how Aerospike's logs and metrics provide deep operational visibility. Learn to troubleshoot faster and optimize real-time systems with Prometheus, Loki, and Splunk.
Blog
Discover how Aerospike's logs and metrics provide deep operational visibility. Learn to troubleshoot faster and optimize real-time systems with Prometheus, Loki, and Splunk.

Modern operations teams don’t have time for guesswork. In high-performance, distributed systems, logs and metrics aren’t just telemetry—they’re how you see what’s happening and why.
In this guide, we’ll show how Aerospike delivers deep operational visibility through native logs, real-time metrics, and seamless integration with tools like Prometheus, Loki, and Splunk. These best practices enable users to troubleshoot faster, optimize smarter, and keep real-time systems healthy at scale. We’ll also highlight new capabilities that help teams fine-tune visibility without sacrificing performance.
We’ll cover what Aerospike provides for both logs and metrics: what's built into the database, how to configure and interpret logs, and how to extend visibility with external tools. We’ll conclude with a hands-on setup walkthrough you can try yourself, or skip ahead here.
Aerospike emits two key types of telemetry data:
Logs: Native, file-based log messages from the database engine, categorized by severity (INFO, DEBUG, etc.) and source component.
Metrics: Aerospike Prometheus Exporter (APE) exposes metrics at a /metrics HTTP endpoint, designed to be scraped by monitoring systems like Prometheus.
External integrations include:
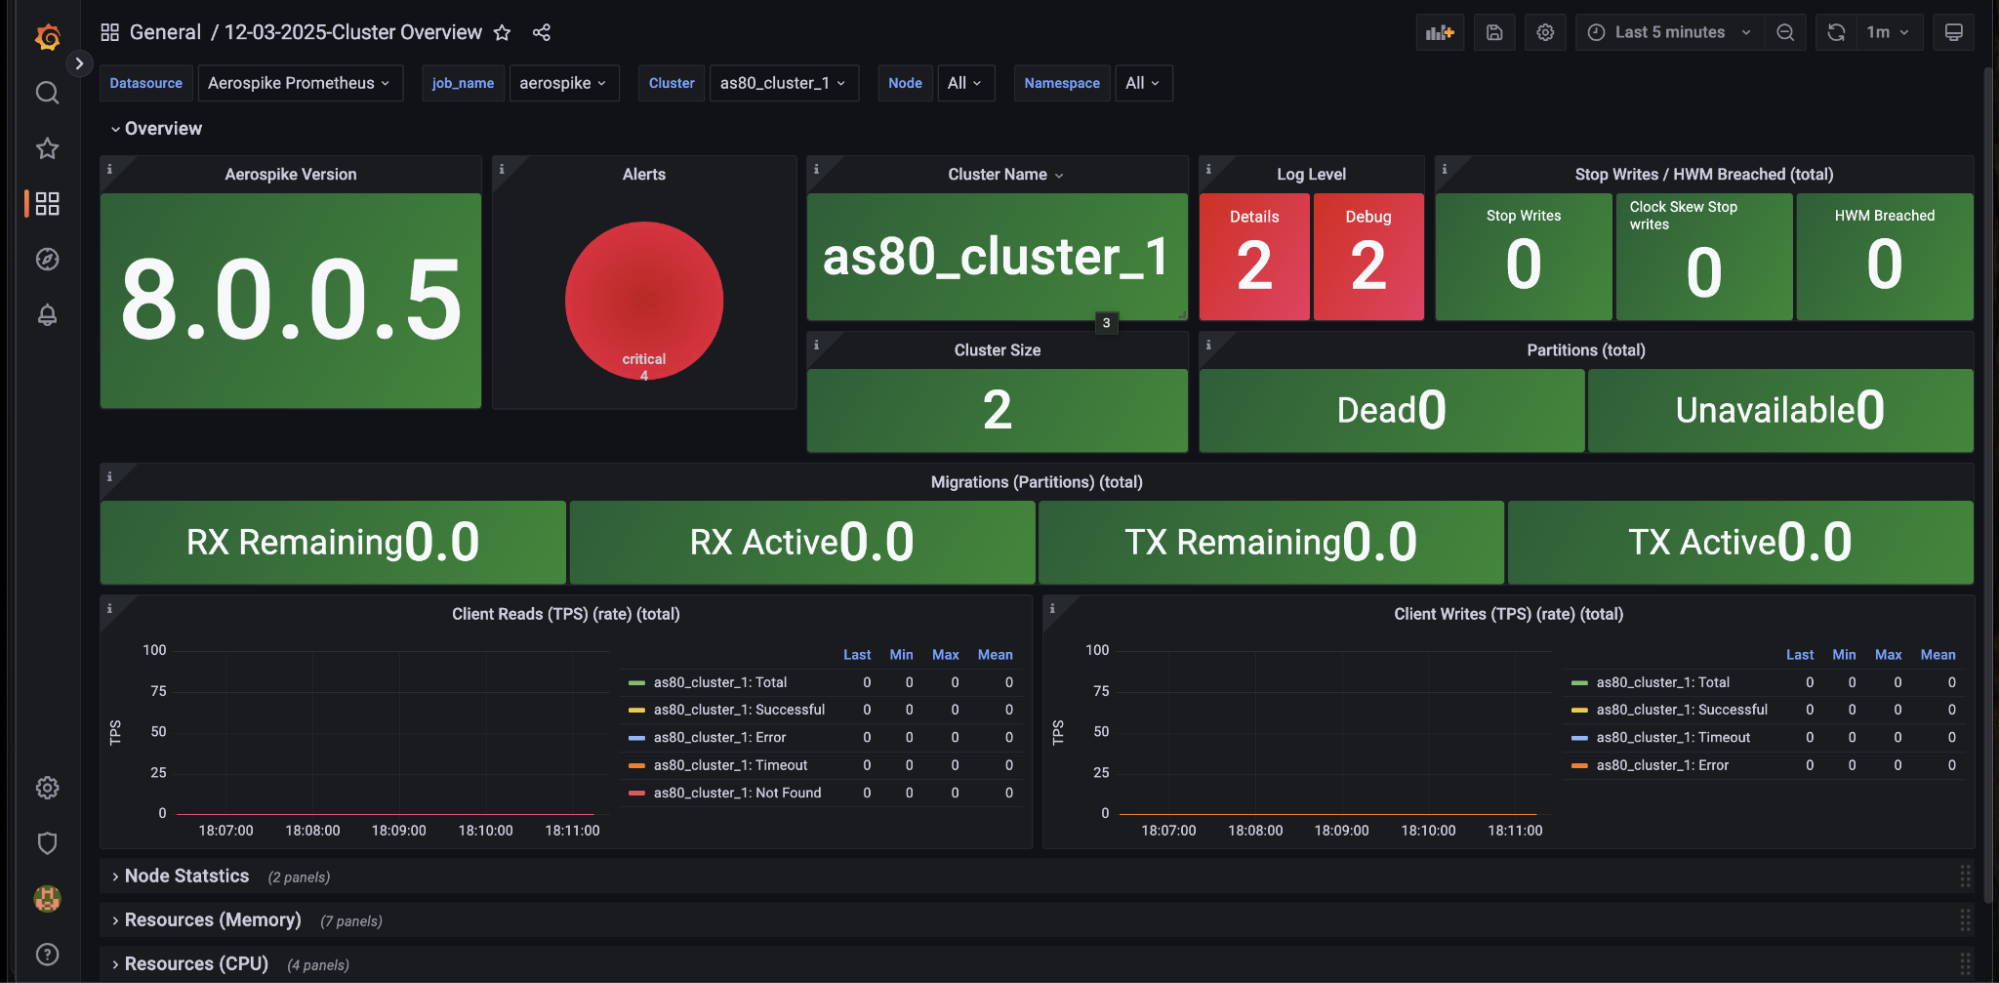
Prometheus: A metrics collection system commonly paired with Grafana. It provides real-time dashboards, alerts, and historical trends.
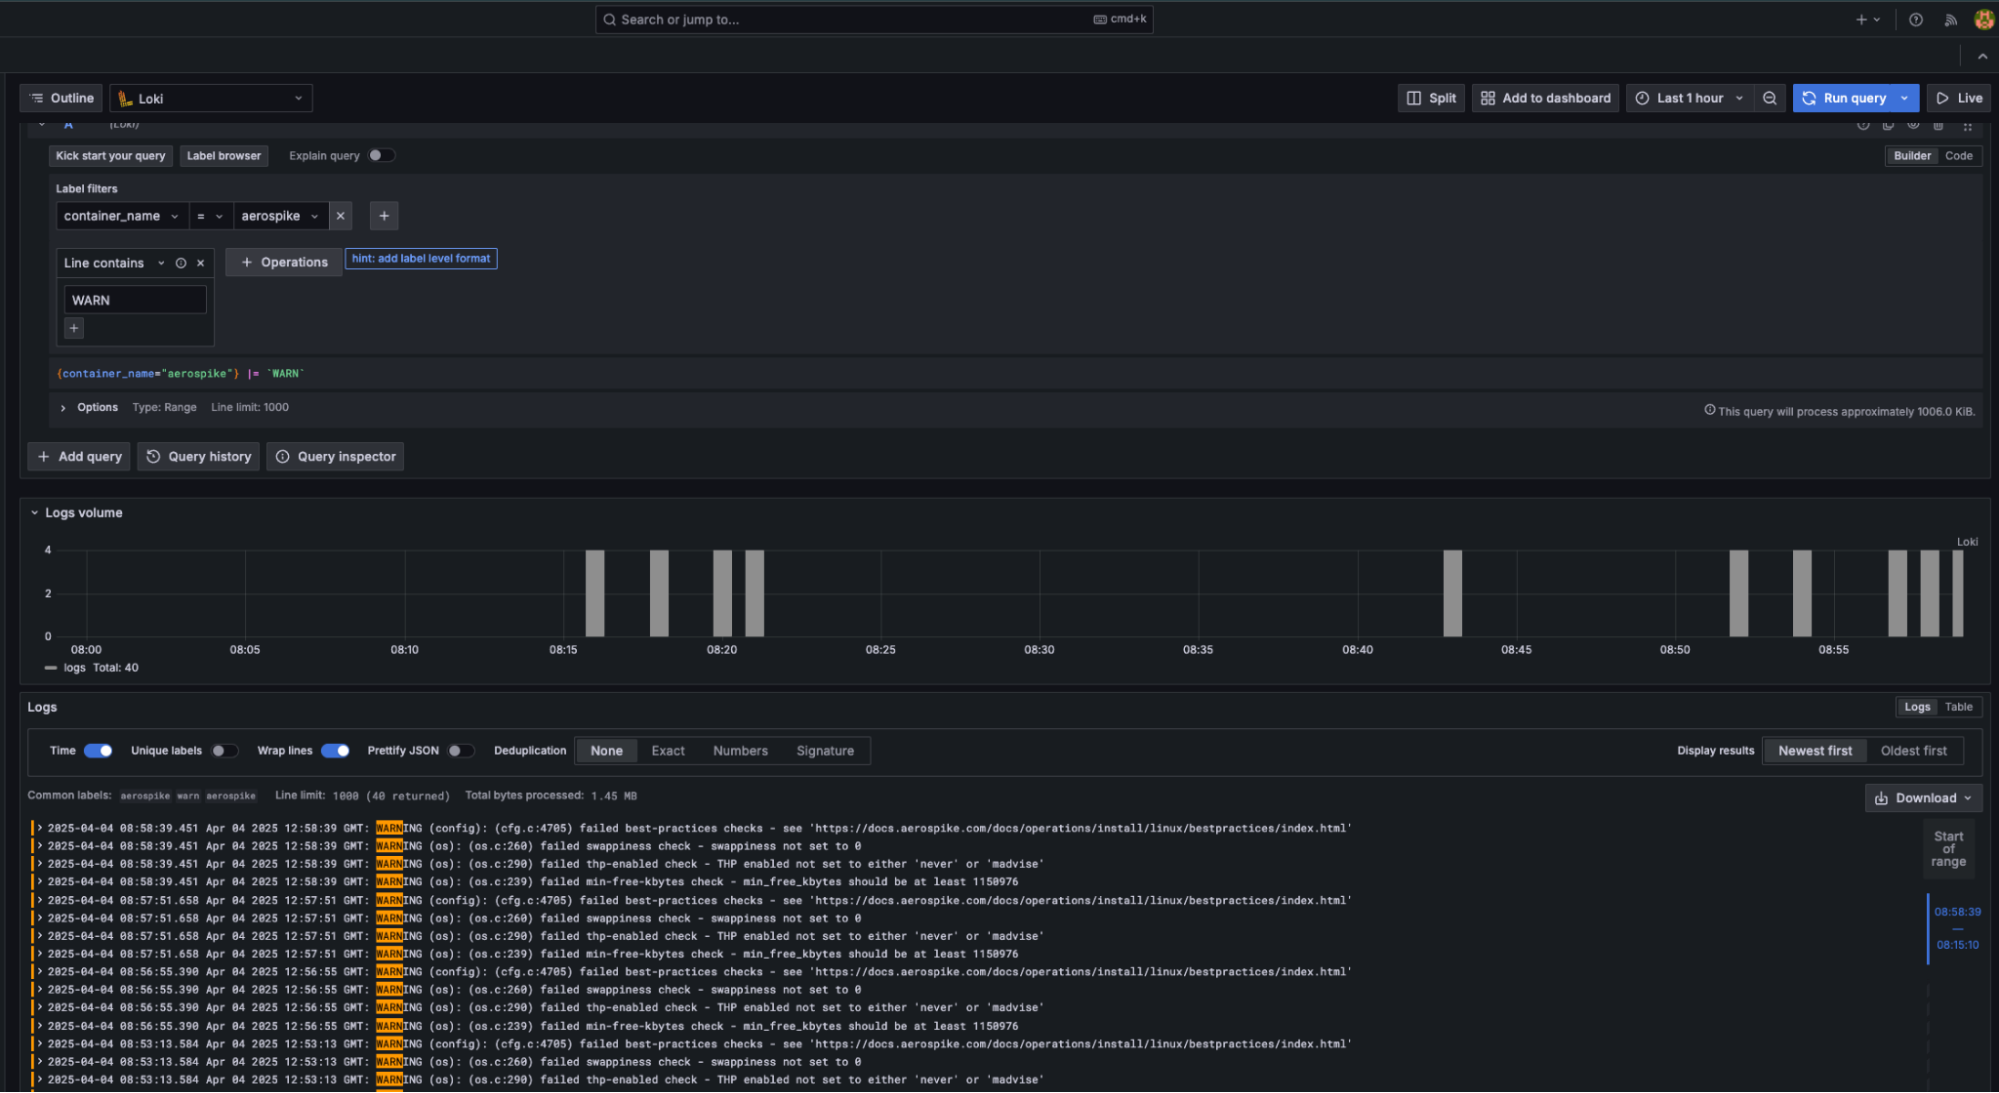
Loki or Splunk: External log aggregation tools that ingest logs from many systems, including Aerospike, and make them searchable, filterable, and easier to analyze over time.
These tools are designed to complement Aerospike’s built-in telemetry. Prometheus can consume Aerospike metrics, and tools like Loki can ingest Aerospike logs as part of a broader observability stack.
Logs and metrics serve different but complementary roles. Here’s a quick guide to what each offers:
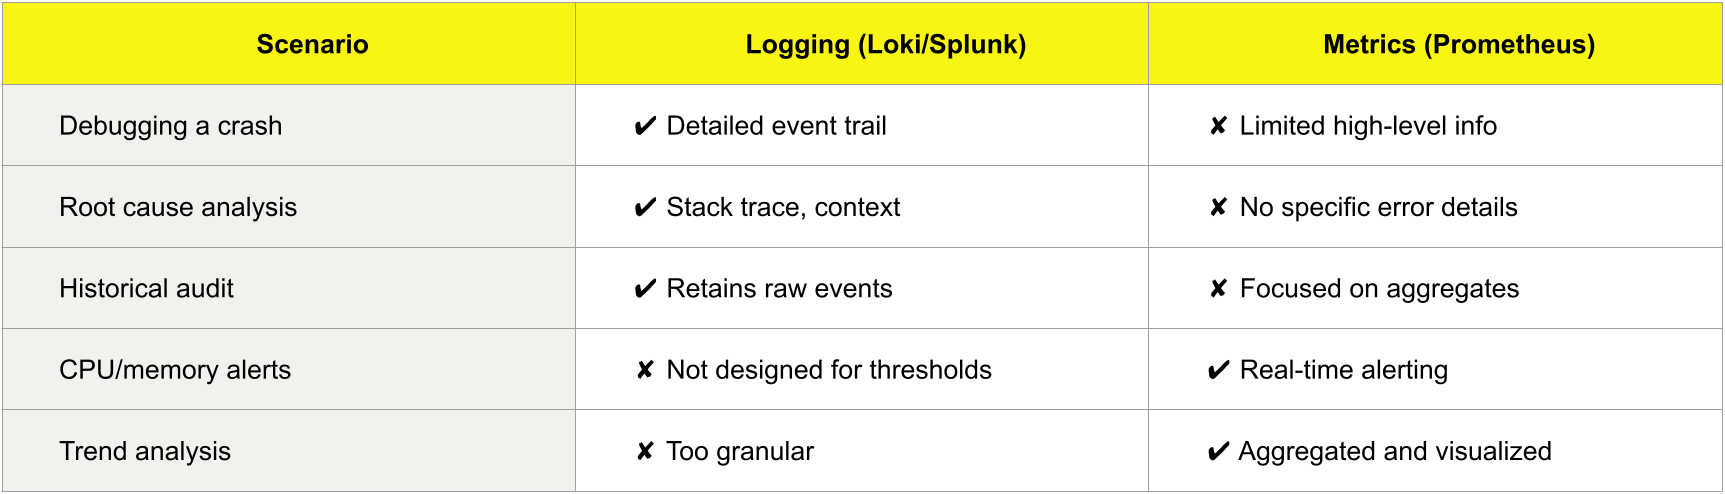
While logs and metrics serve different roles, using them together gives you a clearer operational picture.
Example: Imagine you run a real-time e-commerce platform that personalizes content based on recent user behavior. One evening, Prometheus triggers an alert: write latencies are spiking in one of your Aerospike clusters. This could delay personalized content delivery, which directly affects conversion rates.
You pivot to Loki, where you find a burst of defragmentation activity logged by the SSD subsystem. Now you have a root cause and a fix. Without both telemetry signals working together, you’d be guessing.
Logs tell you what happened. Metrics tell you when and how often. Used together, they tell you why.
Aerospike provides a robust native logging system that helps users track database activities, diagnose issues, and ensure operational stability. Logs are structured and categorized by both event level and severity, making it easier to filter and analyze relevant information.
Aerospike includes a native logging framework that emits structured log lines with component-level detail.
Log event levels (configured via the context field in aerospike.conf):
INFO: Routine operational messages (e.g., startup, configuration changes)
DEBUG: Useful for troubleshooting specific issues during development or investigation
DETAIL: Records a large volume of granular data, including keys of records being read and written. Use with caution in production due to performance and storage overhead
Log severity levels (appear in the log output itself):
INFO: General operational status
WARNING: Potential issues that may require attention
ERROR: Operational problems that may affect stability
CRITICAL: Severe issues needing immediate action
The log levels are configured via the logging stanza in aerospike.conf. For example:
*** normal logging ***
logging {
  console {
    context any info
     }
}


*** debug example ***
logging {
  console {
    context any debug
}
}
Explore our Configure log streams documentation for more logging setup and configuration information.
Aerospike now also provides a dashboard alert if a cluster is left in DEBUG or DETAIL mode, a common cause of unnecessary load and disk use. Leaving verbose logging on in production environments can significantly degrade performance and flood logs with unnecessary data.
While both DEBUG and DETAIL can be extremely useful during investigation or development, they should be enabled selectively and temporarily. For most users, the goal is to collect just enough detail to diagnose an issue, then promptly return to less verbose levels like INFO. Leaving it on longer than necessary can lead to unnecessary load and disk usage.
Aerospike logs are highly structured to make parsing, searching, and alerting easier. Here’s an example log entry and how to read it:
2025-03-13 09:20:41.913Mar 13 2025 13:20:41 GMT: INFO (drv_ssd): (drv_ssd.c:2035) {test} /opt/aerospike/data/test.dat: used-bytes 192 free-wblocks 4087 write-q 0 write (0,0.0) defrag-q 0 defrag-read (1,0.0) defrag-write (0,0.0)Timestamp: Two versions (local and GMT)
Log level: INFO
Component: drv_ssd (Aerospike SSD driver)
Source file and line: drv_ssd.c:2035
Namespace: {test}
Data file: Path to SSD file
Stats: Used bytes, free write blocks, write and defrag queues, and latencies
This specific log shows a healthy SSD subsystem with no write backlog and minimal defrag activity.
Aerospike’s native logging provides deep visibility into what the database is doing at any given moment. It complements monitoring tools like Prometheus, which provide high-level insights and alerts. For most production teams, the ideal setup is to export Aerospike logs to a tool like Loki for detailed investigation, while using Prometheus for continuous monitoring.
By understanding how and when to use each telemetry type, teams can troubleshoot faster, maintain system health, and avoid outages caused by misconfigurations or missed warning signs.
Spin up a full monitoring stack—Aerospike, Prometheus, Grafana, and Loki—using Docker Compose in minutes. Get started with the quick start lab.
Try it out and let us know what you think, especially if you catch an issue on day one or have additional requirements such as client-level logs or metrics. You can reach out through your Aerospike team.
For a deeper understanding and more insights, explore these additional resources.
See more
Blog

Blog

Blog

Blog