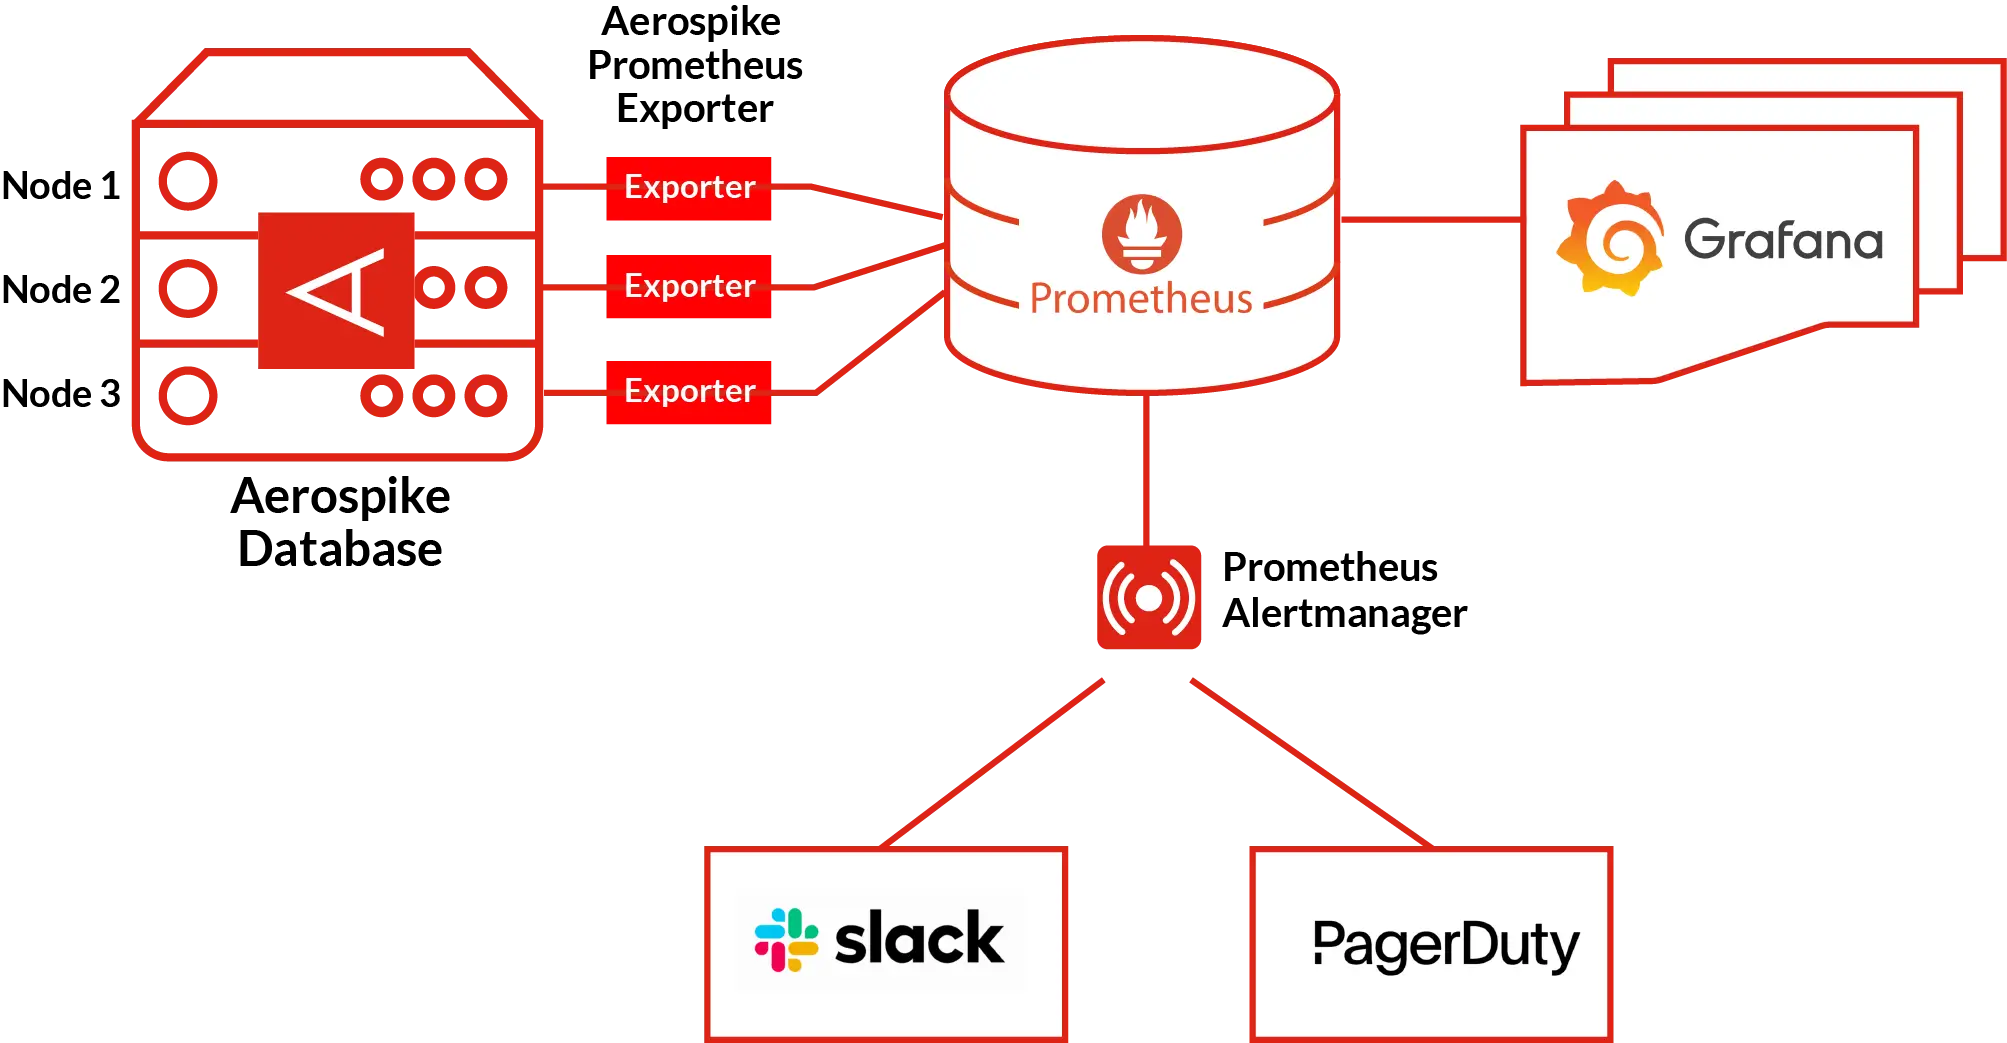
Observability of your real-time data platform has never been this simple. Aerospike Observability provides you with the tools to enable operational best practices that fit your organization’s needs. This starts with the Aerospike Metrics Exporter and Metrics Reference which provide over 500 well-documented metrics with details and examples of how to use them. The Metrics Reference also recommends alerting conditions and provides operational guidance. The Observability Stack also includes curated Grafana dashboards designed to help you navigate multiple clusters or focus on a specific use case.
Observability and management
Easily manage and monitor your real-time database
A rich collection of metrics, dashboards, and integrated command-line tools for observing your database performance.
Comprehensive observability
Across datacenters, regions, clusters and databases spanning over 400 metrics.
Actionable metrics with enriched alerts
Curated and dynamic dashboards with easy metrics navigation based on use cases, issues, and more - at no additional cost.
Standards-based
Open dashboards enable customization. Open Metrics/Telemetry (OTEL) support allows integration with partner solutions.

Comprehensive database observability

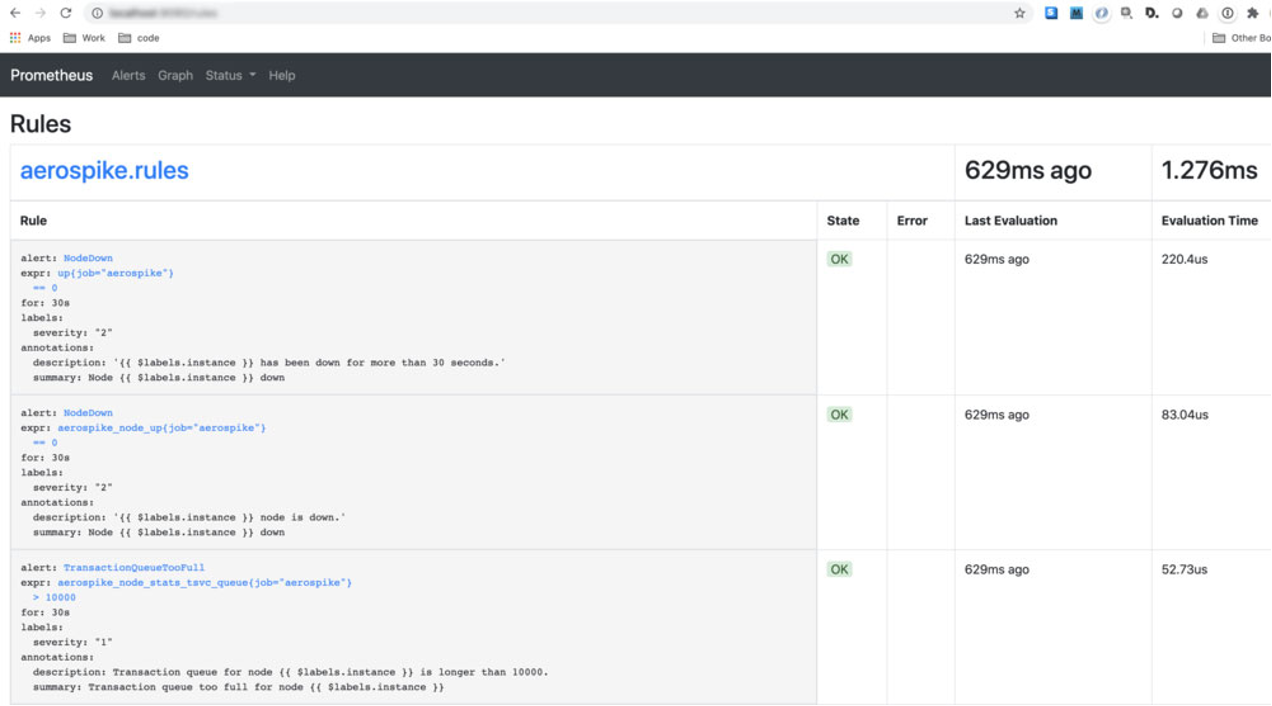
Robust alerting
Distinguishing signal from noise is crucial for busy operations teams. Aerospike includes a default package of alerts that help you identify and prioritize anomalies. The rules for these alerts are flexible and seamlessly integrate into ticketing, chat, and pager systems.


