Blog
Monitoring Aerospike Enterprise in Datadog: What you get and how it works
Learn how Aerospike's native Datadog integration works, what eight pre-built dashboards cover, and how to set it up on your nodes or via Prometheus Exporter.
Blog
Learn how Aerospike's native Datadog integration works, what eight pre-built dashboards cover, and how to set it up on your nodes or via Prometheus Exporter.

Real-time, high-performance workloads demand operational visibility. When a latency spike or degraded node can have immediate downstream consequences, SREs and DevOps teams can't afford a database that's a black box. That means instrumentation needs to fit into the observability platforms that teams already use, rather than building something new alongside them. Aerospike's native Datadog integration is built on that premise.
Aerospike's monitoring stack is designed to be flexible. The Aerospike Prometheus Exporter (APE) serves as the foundation, and from there, operators can route metrics into Datadog, Grafana, OpenTelemetry-compatible pipelines, or other platforms, depending on what their environment already runs. The goal is to meet SRE and DevOps teams where they are.
Datadog is one of the most common stacks in those environments. Native support there was a clear priority.
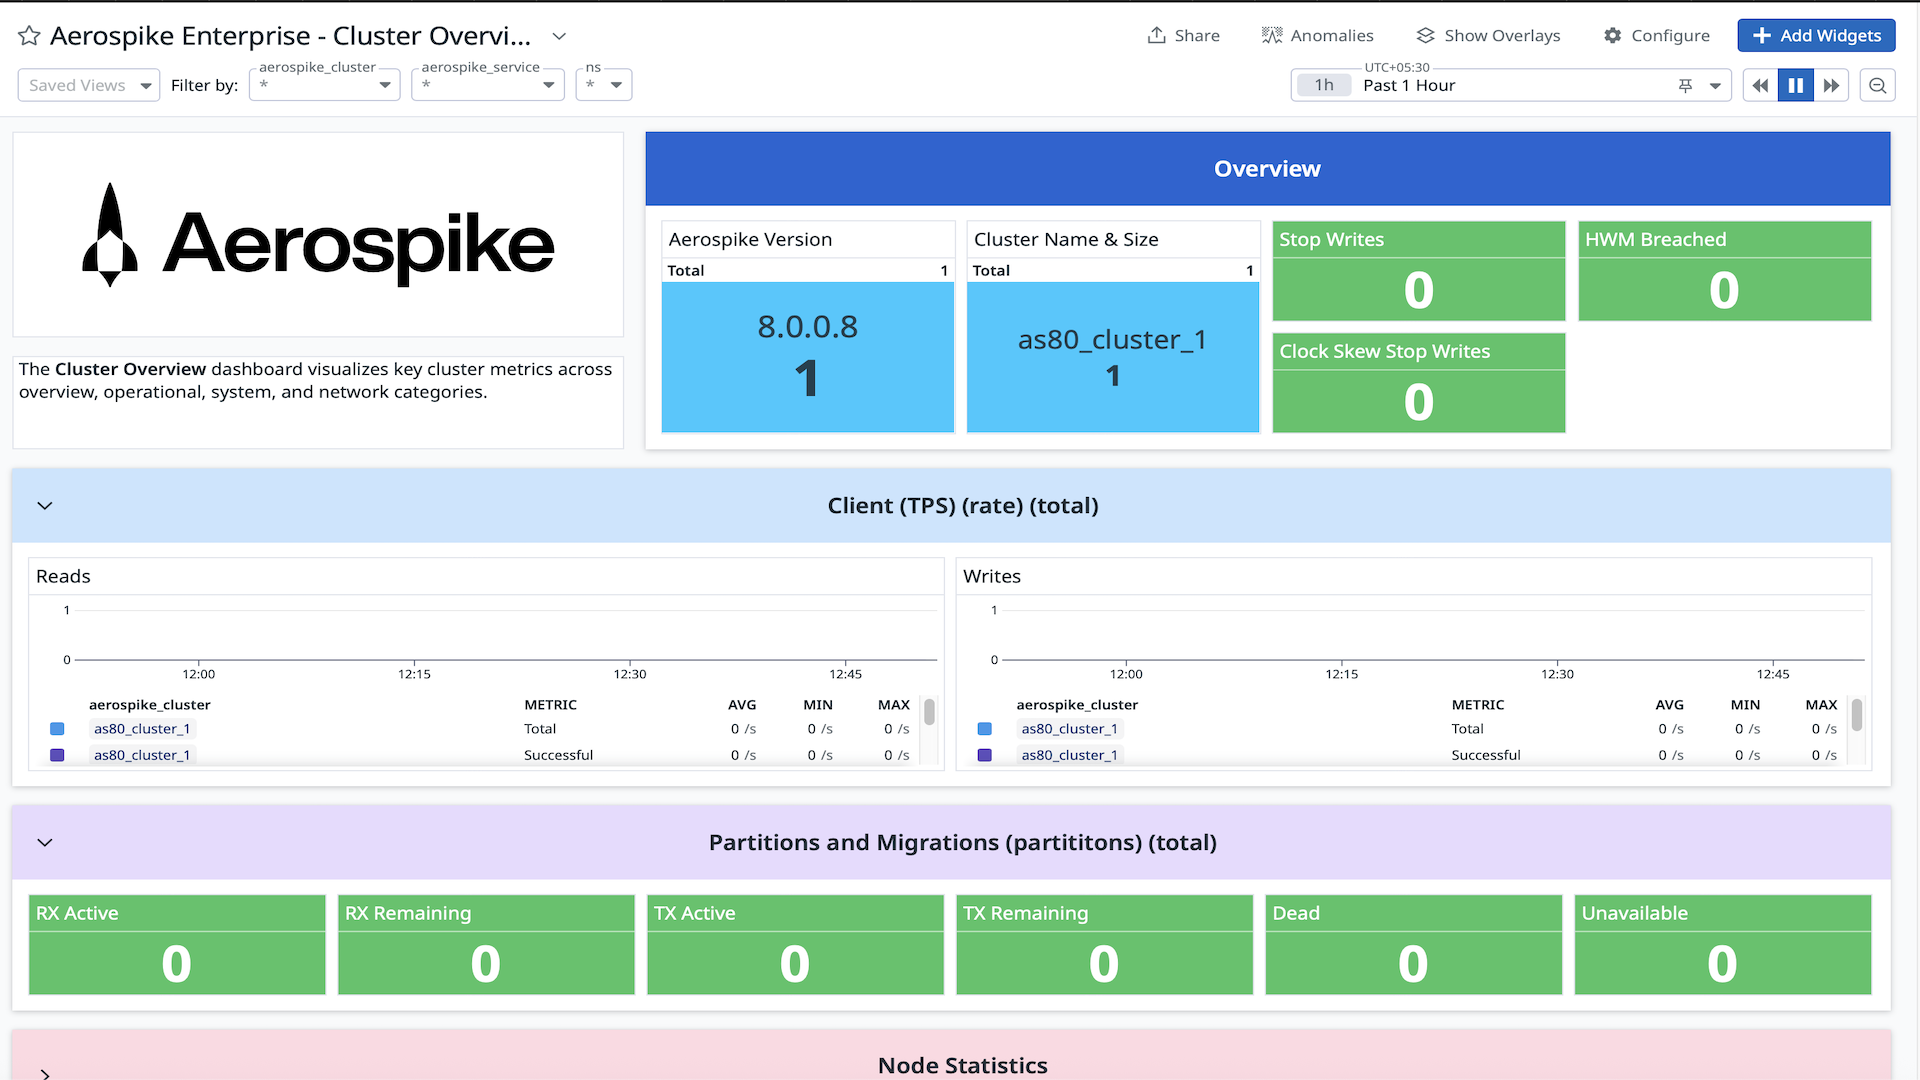
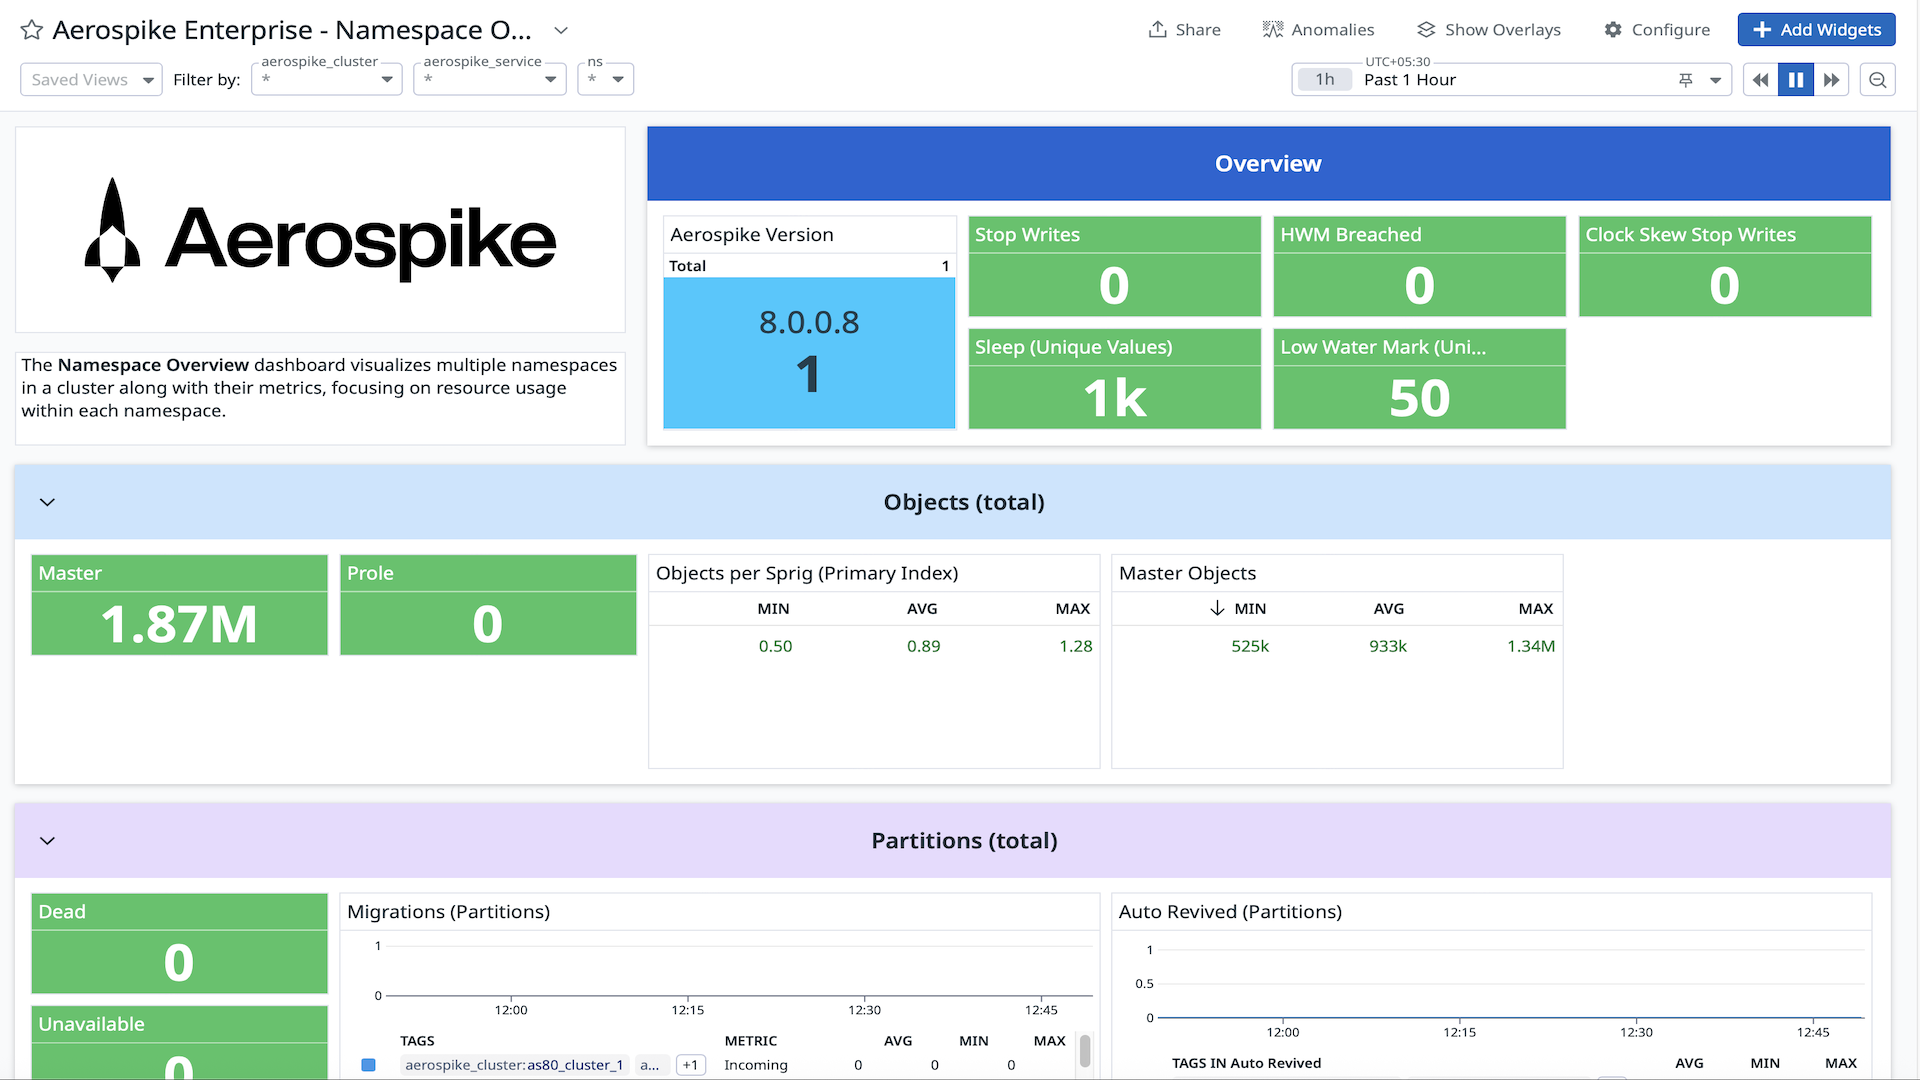
The integration includes eight pre-built dashboards covering the full deployment topology. Examples of the Cluster Overview and Namespace Overview are shown below.
Also available:
Node Overview
Set Overview
Latency Overview
XDR Overview
Rolling Restarts Overview
Secondary Index Overview
The underlying metrics span cluster health, namespace capacity and usage, node-level performance, sets, secondary indexes, Cross Datacenter Replication (XDR) status, and throughput. Latency histograms are among the most frequently used metrics in practice. At microsecond and millisecond resolution across read, write, and batch operations, they give teams a real diagnostic signal rather than a simple up/down health check.
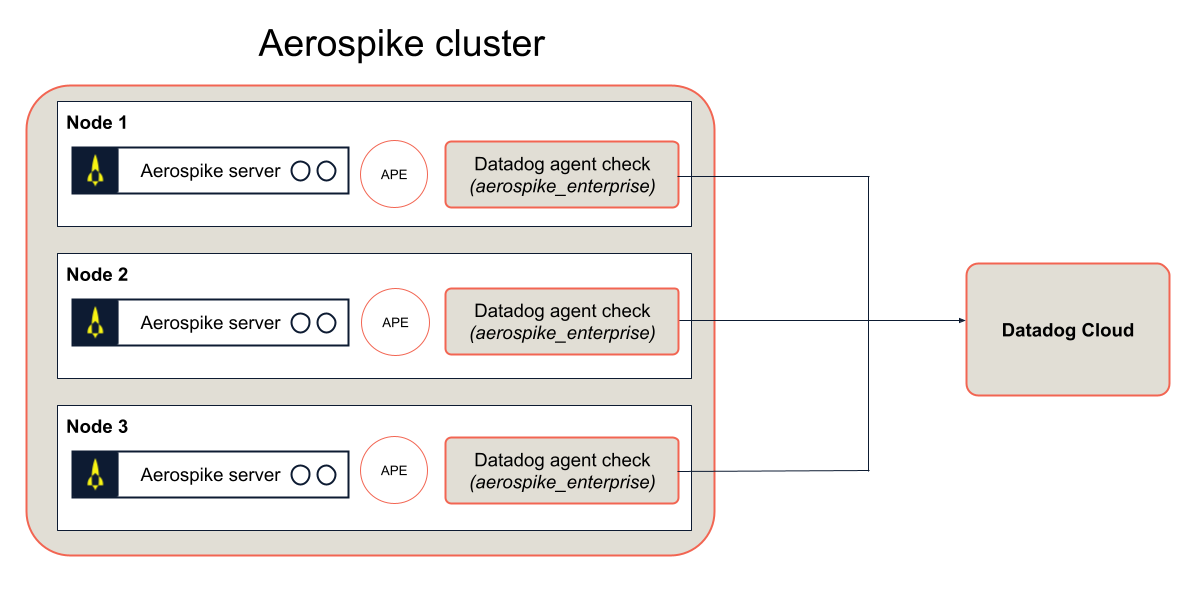
Step 1: Set up the integration on the Aerospike nodes
Two things are needed on each node: the Datadog agent and its Aerospike Enterprise check. The Aerospike Enterprise check is required for the correct metrics to be emitted from the agent.
Aerospike also provides a pre-built Docker image (aerospike/datadog-aerospike-integration:1.0.1) that bundles both together, requiring no separate installation.
Alternatively, the Prometheus Exporter supports sending metrics directly to Datadog Cloud via OTel HTTP, with no Datadog agent required on your nodes.
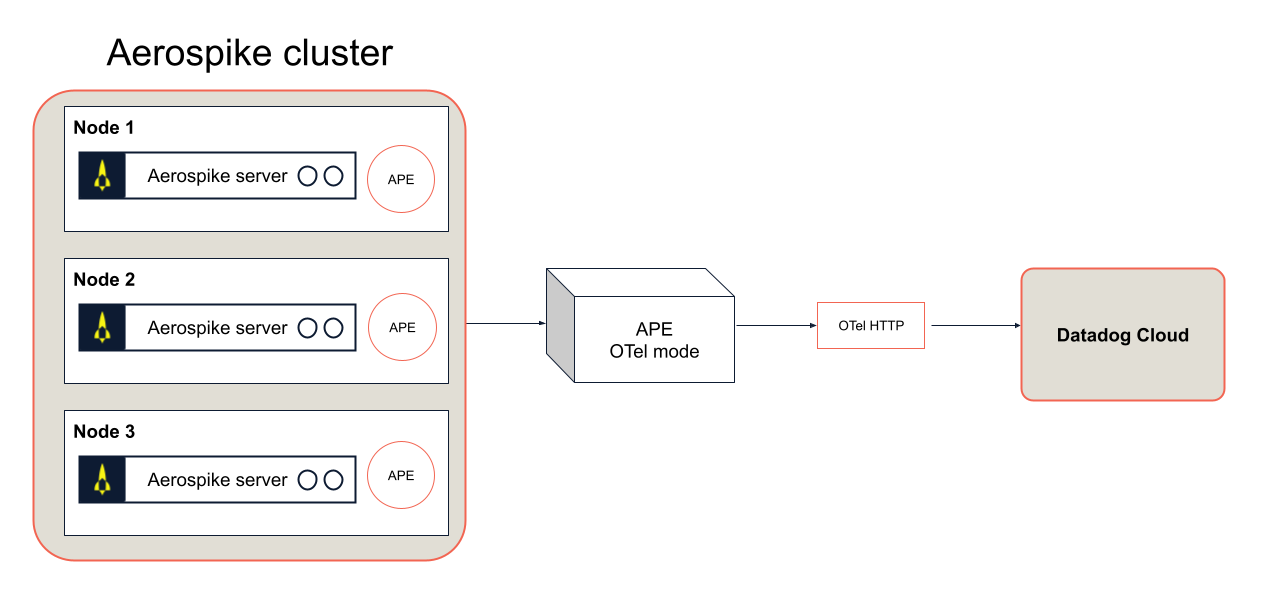
If you haven't set up the Aerospike Prometheus Exporter yet, Aerospike's documentation covers that prerequisite.
Step 2: Install the integration in Datadog Cloud
Once your nodes are set up, you'll also need to install the Aerospike Enterprise integration in the Datadog Cloud UI. This step unlocks access to the pre-built dashboards and ensures the correct metrics are flowing into your Datadog environment.
Full setup details are in the Datadog integration documentation.
Datadog is one integration in a larger push to make Aerospike a well-instrumented, observable system across whatever stack an SRE and DevOps team runs. The Aerospike Prometheus Exporter already supports Grafana, OpenTelemetry, and other platforms, and Datadog is the latest addition to that ecosystem.
For a deeper understanding and more insights, explore these additional resources.
See more
Blog

Blog

Blog

Blog