Blog
Operational and still failing: How healthy dashboards hide system degradation
Healthy metrics, slow users. Learn how systems silently degrade under load through tail latency, tipping points, and metastable failure, and why familiar fixes fail.
Blog
Healthy metrics, slow users. Learn how systems silently degrade under load through tail latency, tipping points, and metastable failure, and why familiar fixes fail.
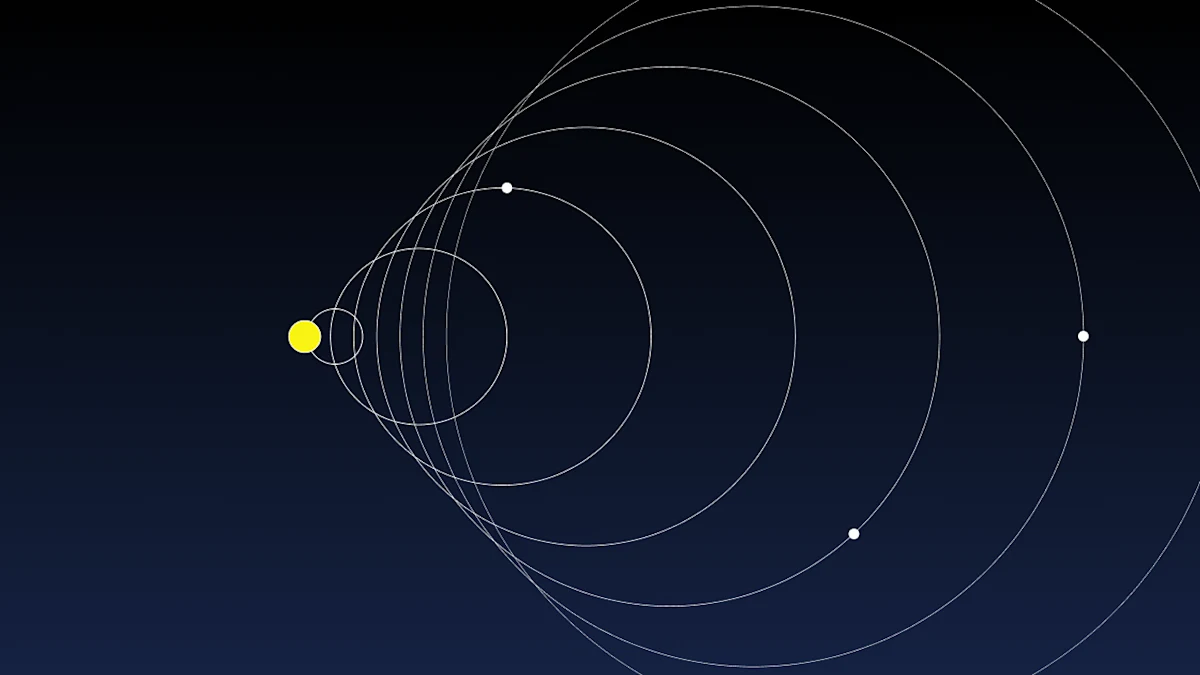
From an operator’s perspective, everything appears exactly as it should. The system logs are clean, CPU usage hovers around 30%, database utilization is low, connection counts are within normal limits, and no alerts have fired all week. Every critical dashboard indicates a clean bill of health. Yet, a small percentage of user interactions remain unexpectedly slow. Although only a fraction of requests are affected, the problem is difficult to diagnose because all operational metrics indicate the system is healthy, even as some users continue to experience unexplained latency.
This disconnect exists because conventional operational metrics measure aggregated indicators, such as resource utilization, average response times, and even p99 latency. Yet, a system with ample spare capacity and excellent p99 latency may still produce occasional but significant latency outliers not visible in these aggregated metrics. These outliers may seem too rare to matter, but the mechanisms discussed earlier in this blog can amplify their impact, causing a significant proportion of end-user interactions to experience unexpected delays.
Operating under load amplifies this problem, allowing systems to appear healthy in operational dashboards while a disproportionate number of user interactions continue to experience delays.
When we think about performance degradation under load, the image that often comes to mind is a system under such intense pressure that resource contention becomes severe. Requests spend longer waiting in queues, some exceed their timeouts and must be retried, and latency rises rapidly as the system struggles to keep up. In these situations, the degradation is immediately visible in operational dashboards. This is simply a system operating beyond the capacity for which it was designed. As long as the architecture scales effectively, the straightforward solution is to add more capacity.
A more subtle problem arises when the load increases, but the system still has ample headroom per its design. CPU utilization remains low, queues are short, and dashboards appear healthy, yet the user experience continues to degrade. These hidden mechanisms are characterized using two metrics: latency jitter and tail spread.
Latency jitter measures the consistency of a system’s response times over time. Two systems may produce the same average latency distribution, yet one delivers predictable performance while the other alternates between periods of smooth operation and bursts of higher latency. Low jitter means the system behaves consistently under a given workload, while high jitter indicates that response times fluctuate more frequently.
As load increases, latency jitter typically increases as well, making slow requests more frequent. The increase can be an order of magnitude, yet still be too small to meaningfully affect average latency or even p99. For example, a latency outlier that previously occurred 100 times per minute may occur 1,000 times per minute under higher load. In a system processing one million requests per minute, this change is unlikely to register on an average or p99 latency dashboard. However, for applications where a single user interaction depends on many backend operations, a tenfold increase in latency outliers means many more interactions are likely to include at least one unexpectedly slow request. To the user, the application feels noticeably less responsive, even though the operational metrics continue to suggest the system is healthy.
Tail spread measures how far the slowest requests deviate from the typical request. A narrow spread means almost all requests complete in roughly the same time, while a wide spread reveals a hidden class of much slower requests.
As load increases, the tail typically widens, but the extent of the widening matters. For example, a system may exhibit an average latency of 0.6 ms, a p99 of 1 ms, a p99.9 of 2 ms, and a p99.99 of 4 ms under normal conditions. Under higher load, while still operating well within its designed capacity, those figures might become 0.6 ms, 1 ms, 10 ms, and 100 ms, respectively. Dashboards would continue to show the same average and p99 latency, giving the impression that the system is performing normally. But in reality, the slowest requests have become dramatically slower, meaning that users whose interactions depend on one of these requests experience much longer delays. As a result, what appears to be an insignificant change in the deep tail can translate into a noticeable increase in slow user experiences.
Latency jitter and tail spread do not increase because systems suddenly run out of CPU or memory. They increase because modern distributed systems contain many components whose behavior changes under load long before traditional resource limits are reached.
Small increases in contention can cause requests to wait slightly longer for internal resources, such as queues, locks, connection pools, storage devices, or network buffers. Individually, these delays are often insignificant, but they do not affect every request equally. Most requests continue to complete quickly, while a small number experience increasingly longer delays. The result is greater latency variability and a wider tail, even though average resource utilization remains low.
Many common optimizations can further amplify this behavior. Cache misses, background maintenance tasks, storage compaction, garbage collection, network retransmissions, and retries all introduce occasional delays that are largely invisible under light load. As utilization increases, these events become more frequent and more likely to overlap, creating a disproportionate increase in long-tail latency without materially affecting average latency.
This is why latency jitter and tail spread should be viewed as behavioral characteristics of a system rather than simply indicators of insufficient capacity. Two systems processing the same workload at the same level of resource utilization can exhibit dramatically different levels of latency variability depending on their architectures and the internal mechanisms they rely on.
The crucial difference between classical performance degradation and these failure modes is visibility. In a traditionally overloaded system, latency increases across the entire distribution. The median rises, queues build, and dashboards clearly show that the system is running out of capacity.
Latency jitter and tail spread behave differently. The median, average latency, and even p99 may remain largely unchanged while the deep tail quietly deteriorates. Slow requests become more frequent, and the gap between the typical request and the worst requests grows wider. As we explored earlier, users do not experience the system's average latency; they experience the slowest operation that blocks their interaction. As jitter increases and the tail spreads, a growing number of user interactions are affected, even though the system still appears healthy. This allows systems to drift towards failure almost unnoticed.
An SLA breach is rarely the moment performance begins to degrade; it is simply the moment the degradation becomes impossible to ignore. Imagine a system with a target that 99% of user interactions must complete within a given latency threshold. Initially, it comfortably exceeds that target, with 99.9% of interactions meeting the objective. As latency jitter increases and the tail gradually widens, more requests fall into the deep tail. The percentage meeting the target gradually declines to 99.8%, then 99.7%, and finally 99.5%. At each stage, more users experience delayed interactions, yet average latency, median latency, and even p99 may still suggest the system is healthy.
Eventually, the system drops below its SLA, and the issue becomes operationally visible. But nothing fundamentally changed at that instant. The system had been becoming less predictable for some time, and users had already been experiencing increasingly inconsistent performance. The SLA breach simply marks the tipping point where the accumulated effects of latency jitter and tail spread become visible to the organization.
If latency jitter and tail spread begin to increase while the system is still operating comfortably within its designed capacity, then simply adding more hardware is solving the wrong problem. Increasing capacity may reduce resource utilization and, as a result, improve latency jitter and tail spread. However, provisioning additional infrastructure to address a problem that occurs well before resource limits are reached is both economically inefficient and operationally unsustainable.
Latency jitter and tail spread are characteristics of the system itself. While they exist to some degree in almost every computer system, their magnitude can vary dramatically between otherwise similar systems. The goal, therefore, should not simply be to add more capacity, but to choose systems whose behavior remains predictable as load grows, systems that maintain low latency jitter and a tight tail spread throughout their operating range. Predictability, rather than spare capacity, is what determines whether a system continues to deliver a consistent user experience.
Healthy dashboards do not necessarily mean healthy systems. Traditional operational metrics are designed to detect resource exhaustion and outright failures, but they often miss the early signs of performance degradation. Long before CPU utilization reaches its limits or SLAs are breached, latency jitter and tail spread can begin to increase, quietly making user interactions slower and less predictable.
This is why predictability deserves to be treated as a first-class performance characteristic. A system that delivers exceptional benchmark numbers but becomes increasingly erratic under load is ultimately less valuable than one whose behavior remains consistent as conditions change. Measuring latency jitter and tail spread makes these hidden failure modes visible, allowing teams to identify degradation before it is too late. The goal is not simply to build systems that remain available under load, but systems that behave predictably even under load.
Many degradation patterns begin at launch, when systems run under light traffic and low utilization, quietly masking existing architectural limits. In this state, systems appear flawless, not because they are inherently stable under pressure, but because they have not yet crossed the threshold where their behavior changes. The first sign of instability is rarely an outage, but rather a widening tail while summary metrics remain deceptively flat.
As systems mature, three quiet variables compound without tripping alarms:
Growth pushes utilization toward untested limits.
New access patterns invalidate load-bearing optimizations.
Routine maintenance leaves the system in a subtly altered, less efficient internal state.
None of these triggers an individual alert, and their collective impact is usually misattributed to the cost of success, rather than recognized as a measurable regression. Instead of diagnosing the root cause, organizations default to funding capacity expansions on the unverified assumption that the system just needs more headroom.
The most useful signals are often already visible, just scattered across dashboards owned by different teams. In isolation, they look like unrelated issues; viewed together, they reveal a coherent failure mode. Many of these issues may surface as variance that tracks the clock. For example, when the same operation on the same codebase slows during peak hours and speeds up off-peak, the system is sensitive to utilization, and a latency graph with a predictable daily rhythm is a sign of a capacity-bound system.
Retry amplification is an even more volatile issue: a request times out, the client retries, the retries add load, the added load drives more timeouts, and the system begins manufacturing the very conditions it is reacting to. After an incident or failover, dashboards return to green, but latency levels may never return to their old baselines, as though the systems had shifted into a worse equilibrium. A common example is a connection pool that never fully warms up after a disruption. Every downstream request now pays a connection setup cost that it didn't before, and that overhead persists until someone intervenes.
Underneath all of this, the alerts often stay quiet because monitoring is anchored to the wrong layer. CPU and other infrastructure indicators look normal while application-level resources, such as internal queues, connection pools, and thread pools, reach saturation. Adding hardware provides temporary relief, only for the same bottleneck to reappear, because the constraint was never the layer you were watching.
The standard interventions all target a symptom of variance rather than the mechanism generating it, which is why each stabilizes the system just long enough to close the incident before it drifts back. Adding capacity pushes the cliff further out but leaves the loop intact, and a larger system simply supports a larger feedback loop once it tips. And once in a failure state, the system may lack spare resources to perform a reconfiguration, and the reconfiguration itself can increase load and make things worse. Introducing a cache helps cache hits and does nothing for misses, and under heavy fan-out, the miss path dominates, which is exactly where tail latency accumulates. Tightening timeouts is the most paradoxical lever of all, because shorter timeouts convert slow requests into failures, which accelerates retries and intensifies the loop you're trying to escape.
The shared pattern is that each fix targets a symptom rather than the underlying cause. Teams that rely on these remediations often find themselves revisiting the same issue quarter after quarter, suppressing recurring behavior with tools that were never designed to address the dynamics producing it. The tail keeps widening because the fixes change the conditions around the system, not the feedback loops driving its behavior.
Systems that remain available but quietly degrade for a subset of users can impose high costs long before the first visible signs of failure appear. The burden shows up first in engineering time spent on recurring firefighting, the same investigations, the same temporary fixes, the same issues quietly resurfacing. It’s also paid for in excess capacity provisioned for worst-case scenarios, which mostly sits idle as insurance. And it’s paid for in intermittent slowness that erodes user trust without ever becoming a true outage, leaving no clear moment to justify a postmortem.
There's a human cost, too. Burnout and attrition correlate with systems that look "healthy" by conventional metrics, yet repeatedly wake the same engineers for the same unresolved behavior. The absence of an outage is not the same as health. A system can hit its uptime targets, return zero errors, and still fail its users in the tail every day.
The behavior worth optimizing for is one that stays bounded as conditions change and never enters a state it can't recover from on its own. Peak performance is the wrong target in isolation; chasing it can be part of the trap, since a system tuned for speed under ideal conditions tells you almost nothing about how it behaves once those conditions degrade. What matters is predictability under volatility, not raw throughput. That distinction separates systems that stay stable from those that slowly drift.
A system you can rely on isn't the one with the best numbers on a good day. It's the one whose behavior remains consistent when load rises, access patterns shift, nodes fail, and the assumptions baked into your testing no longer align with production.
Once you start recognizing patterns of system degradation in your own systems, you can look beyond dashboards, incident reports, and the quick fixes that never seem to last. Building durable resilience requires more than applying a handful of techniques; it starts with understanding why the feedback loop becomes self-sustaining in the first place. This leads to the more important question of what makes distributed systems behave this way, and what it actually takes to keep them bounded and predictable. By answering these questions, you can move from systems that appear stable to systems that actually are.
For a deeper understanding and more insights, explore these additional resources.
See more
Blog

Blog
Blog
Blog
