Blog
Fast like a cache, priced like storage: Benchmarking Aerospike on Feast
See how Aerospike matches in-memory latency as a Feast online store while cutting RAM footprint and infrastructure costs versus Redis and DynamoDB benchmarks.
Blog
See how Aerospike matches in-memory latency as a Feast online store while cutting RAM footprint and infrastructure costs versus Redis and DynamoDB benchmarks.

We recently launched an integration between Aerospike and Feast, giving teams a straightforward way to use Aerospike as the online store behind Feast's real-time feature serving. As part of that work, we wanted to understand how Aerospike performs under the workloads that matter for Feast users.
We benchmarked Aerospike as a Feast online store using Feast’s benchmark harness and compared the results with the Redis and DynamoDB results published in the same repository. The tests varied the number of entities per request, the number of features per request, and the request rate.
We used Feast's benchmark harness end-to-end, from the load generator through the Python feature server to the online store.
We tested three dimensions of the workload:
Entities per request. A single-entity request represents a scoring call for one user or transaction. A request containing many entities represents batch scoring or a model evaluating many candidates at once.
Features per request. More features represent a richer model and a larger amount of data that must be retrieved for each prediction.
Request rate. Increasing the request rate tests how each online store behaves as concurrency and load increase.
Sweeping these axes separately allows us to observe how a store behaves under specific workload shapes rather than relying on a single latency number.
Teams can use the publicly available harness to run the tests on their own hardware and workloads. The repository publishes results for several online stores. We reviewed all of them and compared Aerospike against Redis and DynamoDB, setting Datastore aside because its data is several years old and the service has since been rebuilt as Firestore in Datastore mode.
The Aerospike tests used a c2-standard-16 GCP VM. Redis and Aerospike were co-located with the feature server, while DynamoDB was accessed as a managed service over a same-region network connection. We reproduced the community harness as published rather than running a controlled benchmark of our own, so running the load generator, feature server, and store together on one VM reflects that harness convention rather than a production topology.
Because competitor results were collected on different hardware and at different times, we focus on workload behavior rather than precise latency multiples. These results should be read as workload comparisons rather than universal performance claims.
The first set of tests increases the number of entities requested at once.
A single-entity request is the common case, a fraud check or a personalization call scoring one user. Larger requests show up in recommendation and bidding systems that score many candidates at once to pick among them, so a single prediction can require tens or hundreds of entities in one read.
Aerospike tracks the in-memory store closely on these ordinary reads. On single-entity and modest-batch requests, Aerospike and Redis sit together in the low tens of milliseconds, with the lead moving between runs within normal measurement variance.
DynamoDB is several times higher in these tests.
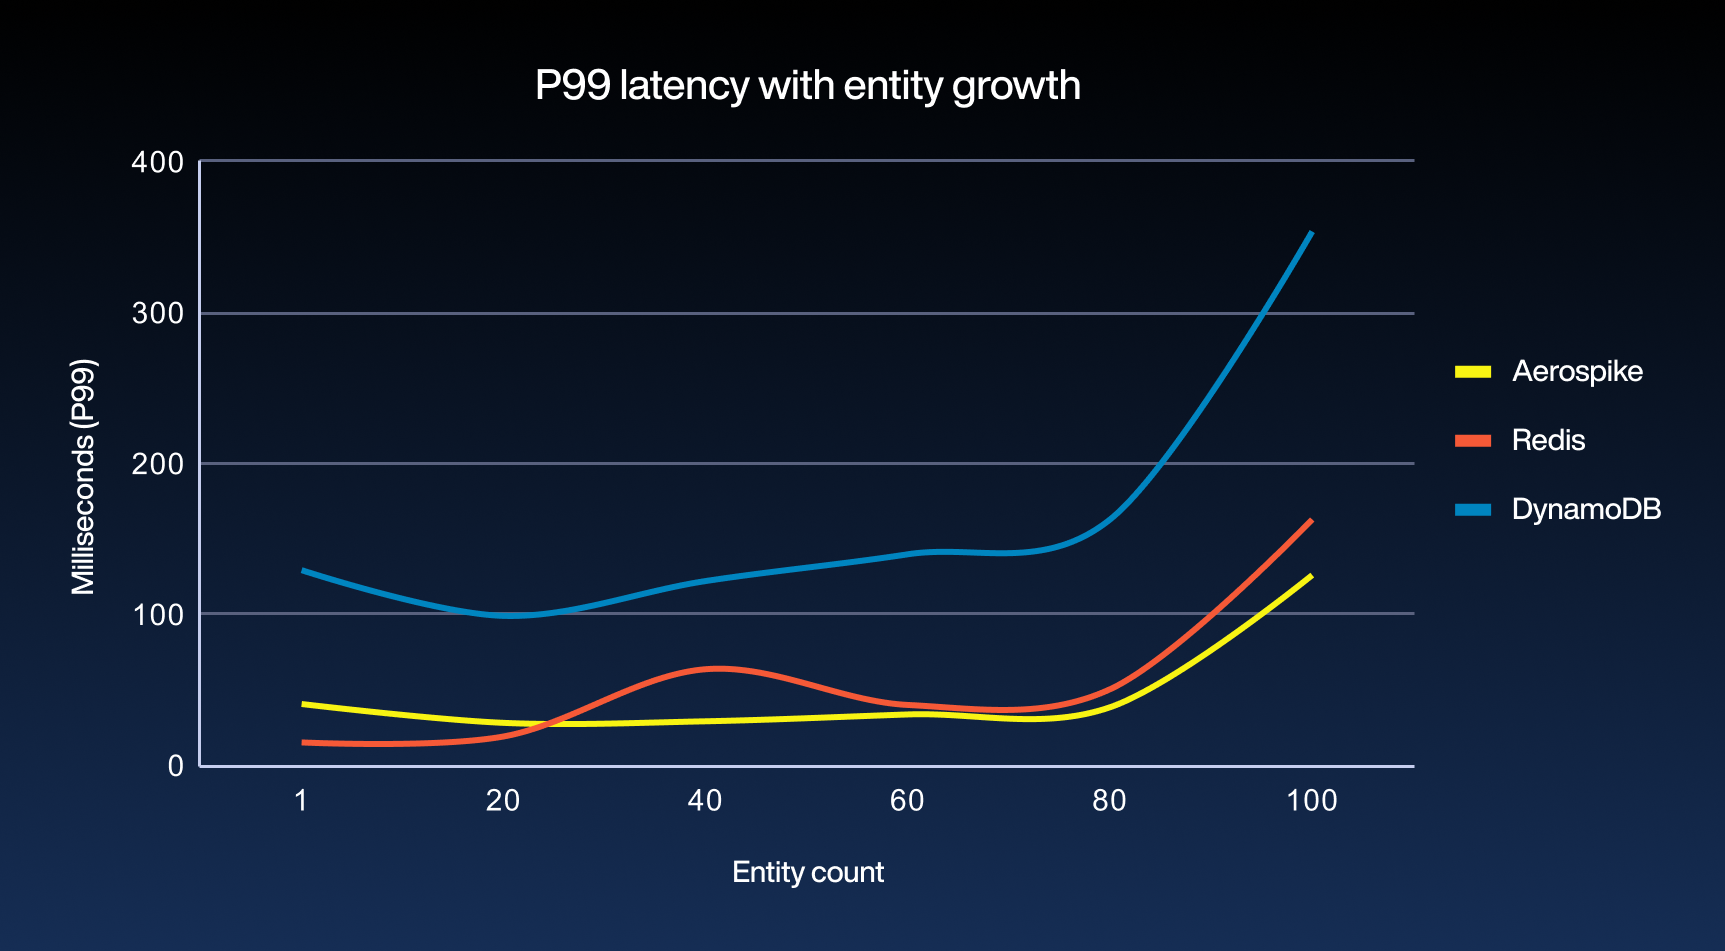
This matters because Aerospike is not keeping the entire dataset in RAM. Its Hybrid Memory Architecture (HMA) keeps primary indexes in memory while storing feature data on SSD.
A read that an in-memory store handles quickly, Aerospike can handle in a similar latency range without requiring an all-in-memory deployment.
The second sweep increases the number of features retrieved for each entity.
As the feature count increases, each request contains more data and places more work on the online store. Feature counts climb as teams add signals to a model: a mature fraud model may pull a wide set of velocity, history, and device features about a single entity, which is why the widest requests are realistic and not a stress-test artifact.
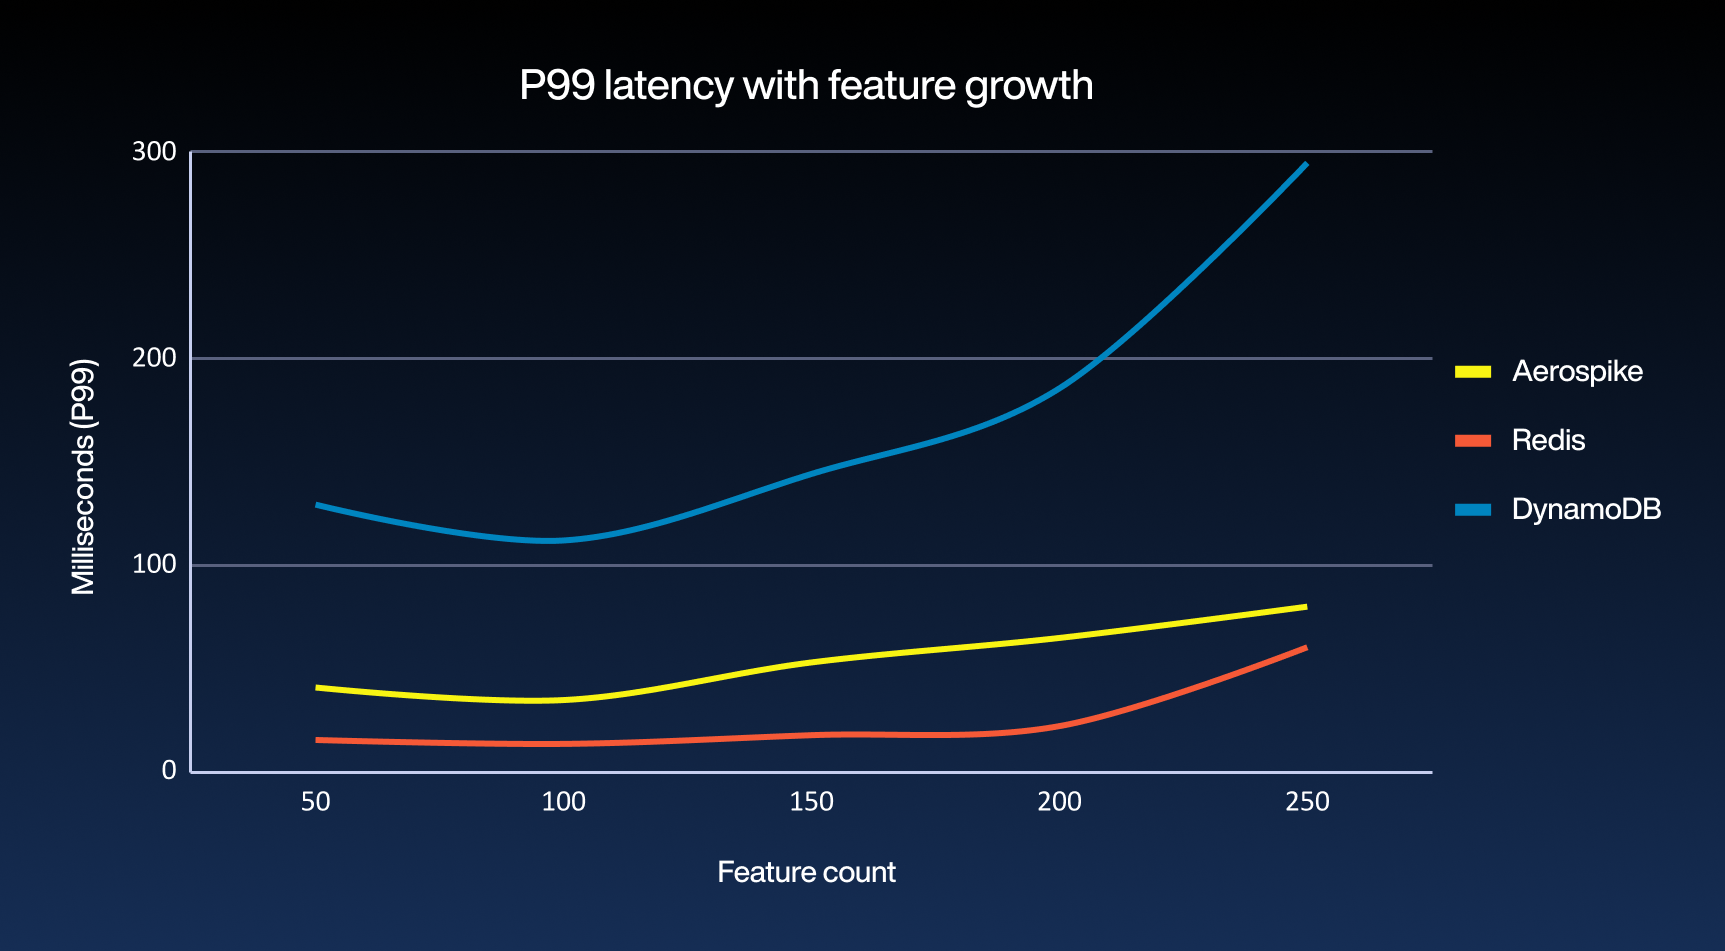
As the request gets wider, Aerospike stays in the same low range as the in-memory store, and both stay well below DynamoDB. A production feature store needs to maintain predictable serving behavior as feature sets become larger.
The third sweep increases the request rate, which is driven by traffic, not by the model. An ad-bidding or fraud-scoring service, at peak, fields thousands of decisions per second, and each decision can be one of these multi-entity reads, so entity-batch size and request rate rise together rather than independently.
The harness includes running 100 entities and 50 features per request at increasing requests per second (RPS).
Aerospike maintains 100 percent success across the full range tested.
Redis holds to about 60 requests per second before success rates begin to fall. At 80 requests per second, only about a quarter of requests succeed, and at 90 requests per second success approaches zero.
DynamoDB is degraded from the first step, with about 72 percent success even at 10 requests per second. In this case, the limiting behavior is throttling rather than latency.
The failures under load are different. Throttling and timeouts represent the behavior of the stores under the tested workloads and do not depend on the same topology effect.
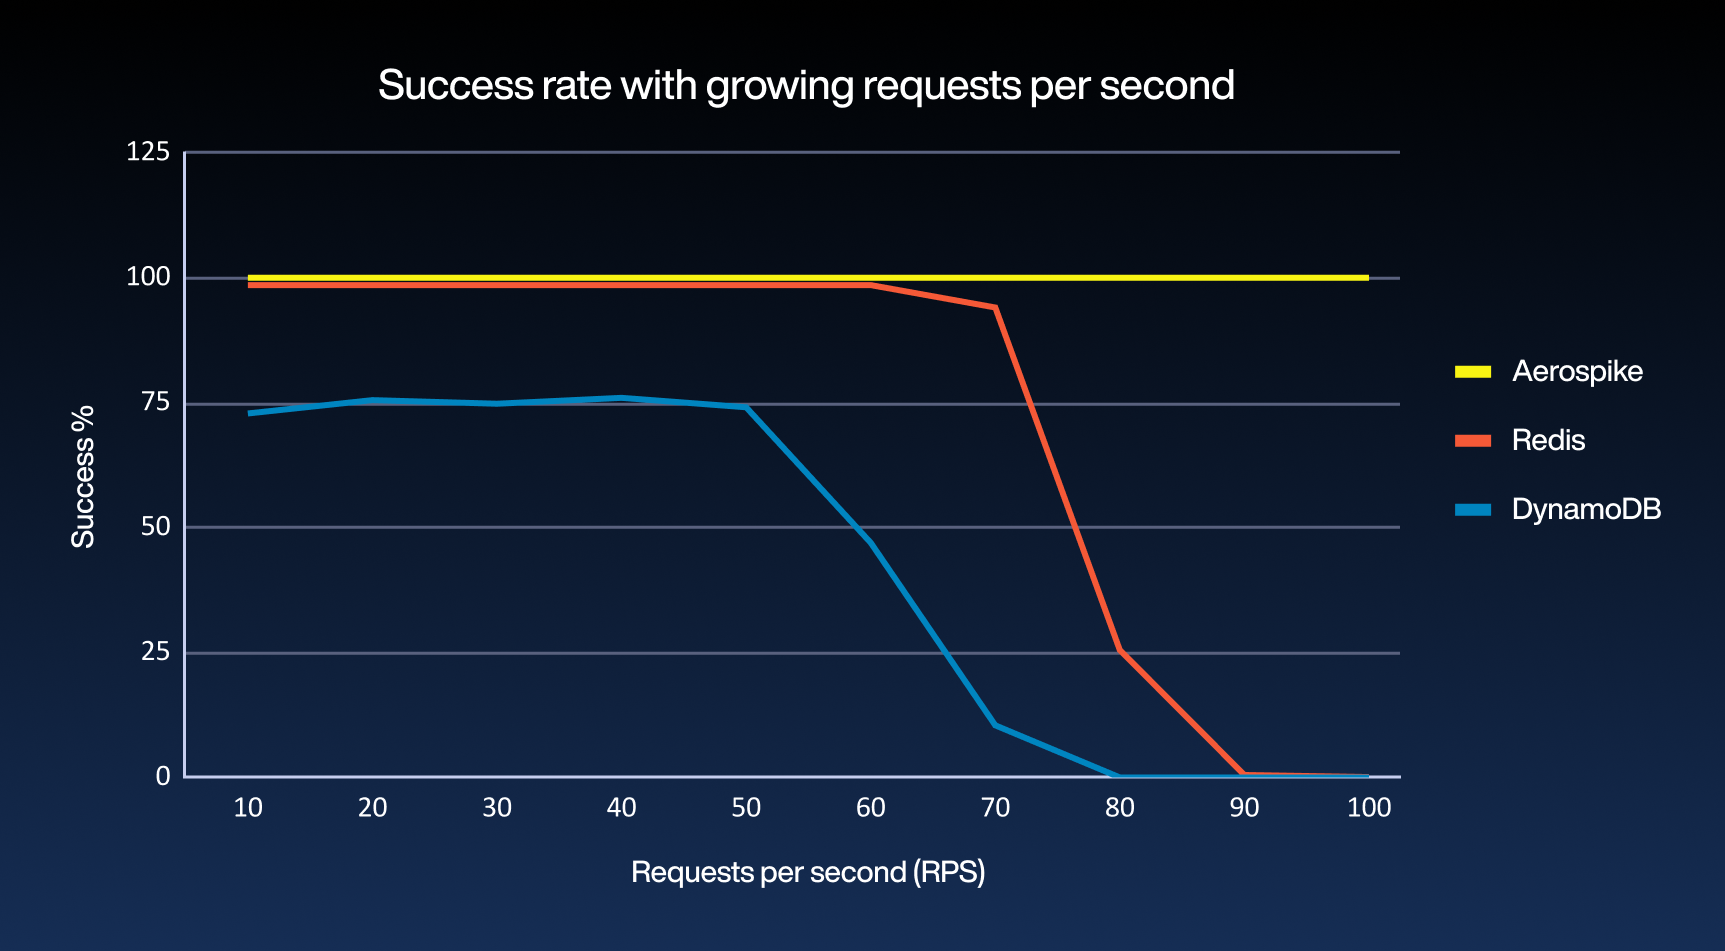
Aerospike keeps serving successfully as both request size and request rate increase, while the other stores stop completing requests.
We also tested a request shape of 100 entities by 250 features. At this workload, Aerospike is the only store that completes any requests at all, and only at the lowest request rates.
That result marks the practical ceiling of the complete serving stack under this test configuration rather than the maximum capability of any individual database. The feature server, network, client, and load generator all contribute to the result.
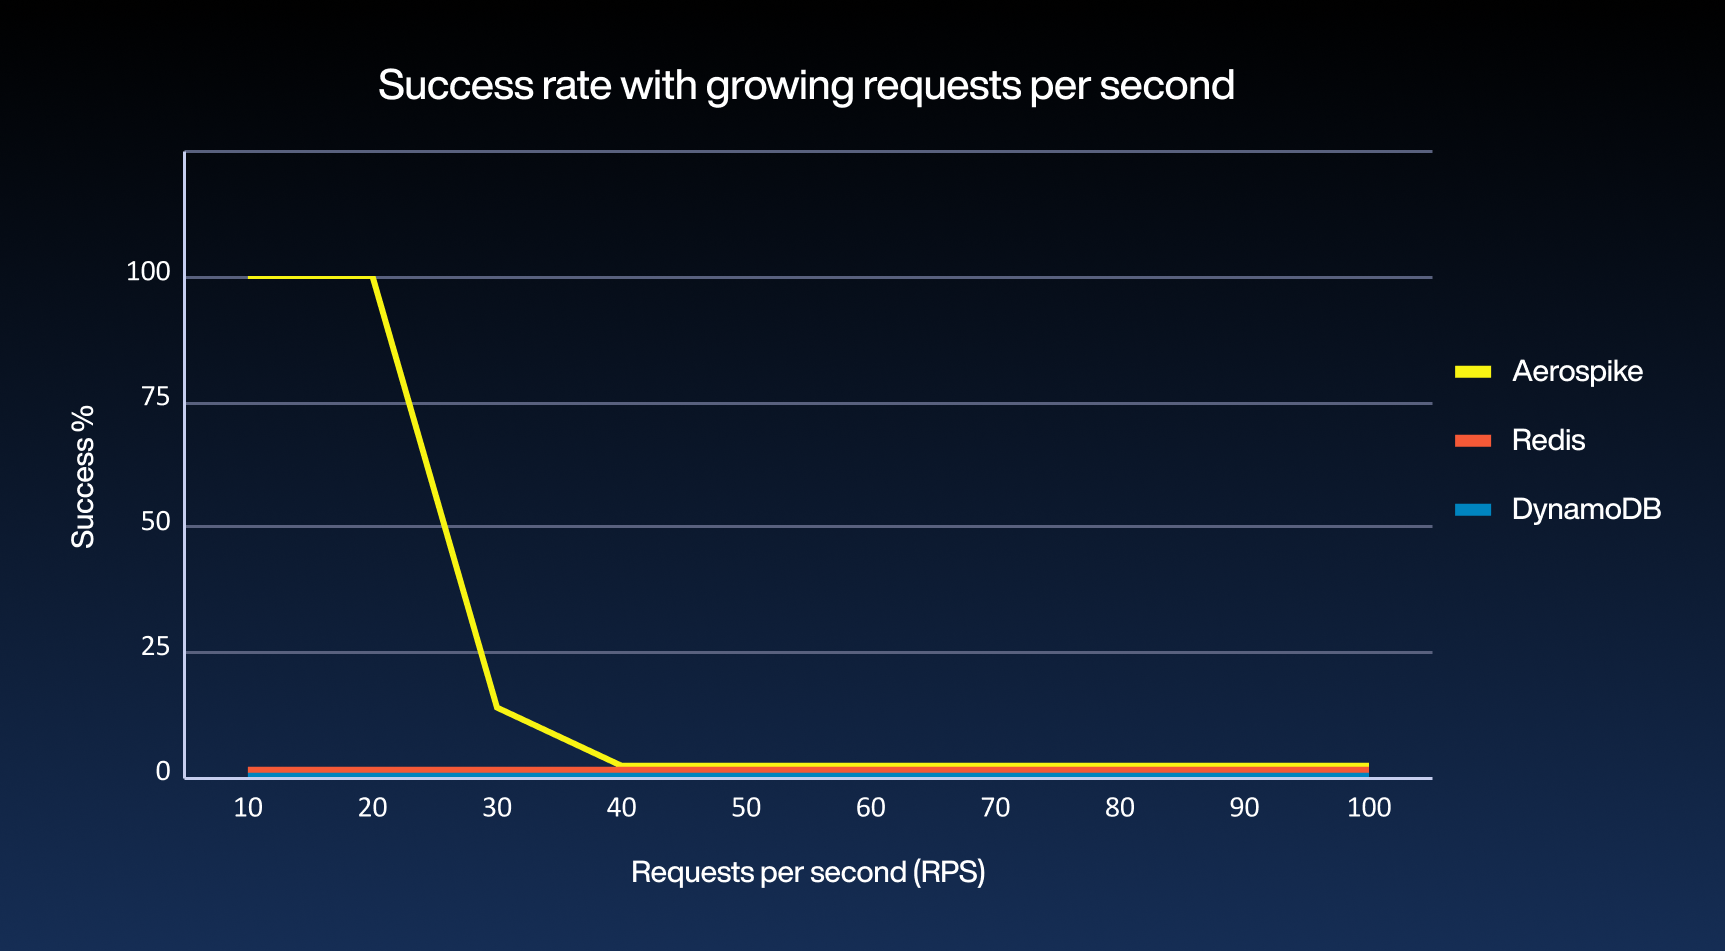
This test is useful for a different reason than the smaller requests. It shows what happens when the amount of data required for each request becomes large enough that the serving stack itself becomes the limiting factor.
Taken together, the tests show a consistent pattern. Aerospike delivers near in-memory latency on smaller feature requests while maintaining successful serving as request sizes and rates increase.
That combination matters for feature stores because the workload can change in both dimensions over time. A model may start with a relatively small feature set and later add more features. An application may begin with modest traffic and eventually serve millions of predictions.
Aerospike’s HMA addresses these requirements: indexes remain in memory for fast lookups, while feature data can reside on SSD. The performance results address one side of the tradeoff. The other is infrastructure cost: how much memory is required to deliver that performance as the feature set grows?
Performance is only part of the equation. The infrastructure required to keep an online feature store entirely in memory can become a significant cost as the dataset grows.
Consider a deployment with:
50 million entities
100 online features per entity
An average value size of 8 bytes
That produces about 40 GB of raw feature data.
Encoding overhead and replicas for high availability increase the provisioned footprint to roughly 120 GB.
An all-in-memory Redis deployment would need to hold that entire footprint in RAM. With Aerospike HMA, the feature data can reside on SSD while only the index needs to remain in memory. For this example, the index requires only a few gigabytes of RAM.
The advantage comes from how much memory each design needs:
Model | In RAM | On SSD |
|---|---|---|
Redis (RAM) | ~120 GB | None |
Aerospike (index RAM, data SSD) | ~6 GB | 120 GB |
Redis holds the entire footprint in RAM. Aerospike keeps only the index there and puts the feature data on SSD. Because RAM costs more than fifty times as much per gigabyte as SSD, moving the bulk of the footprint off memory cuts the RAM you have to provision by roughly 20 times, and the total infrastructure cost by an order of magnitude.
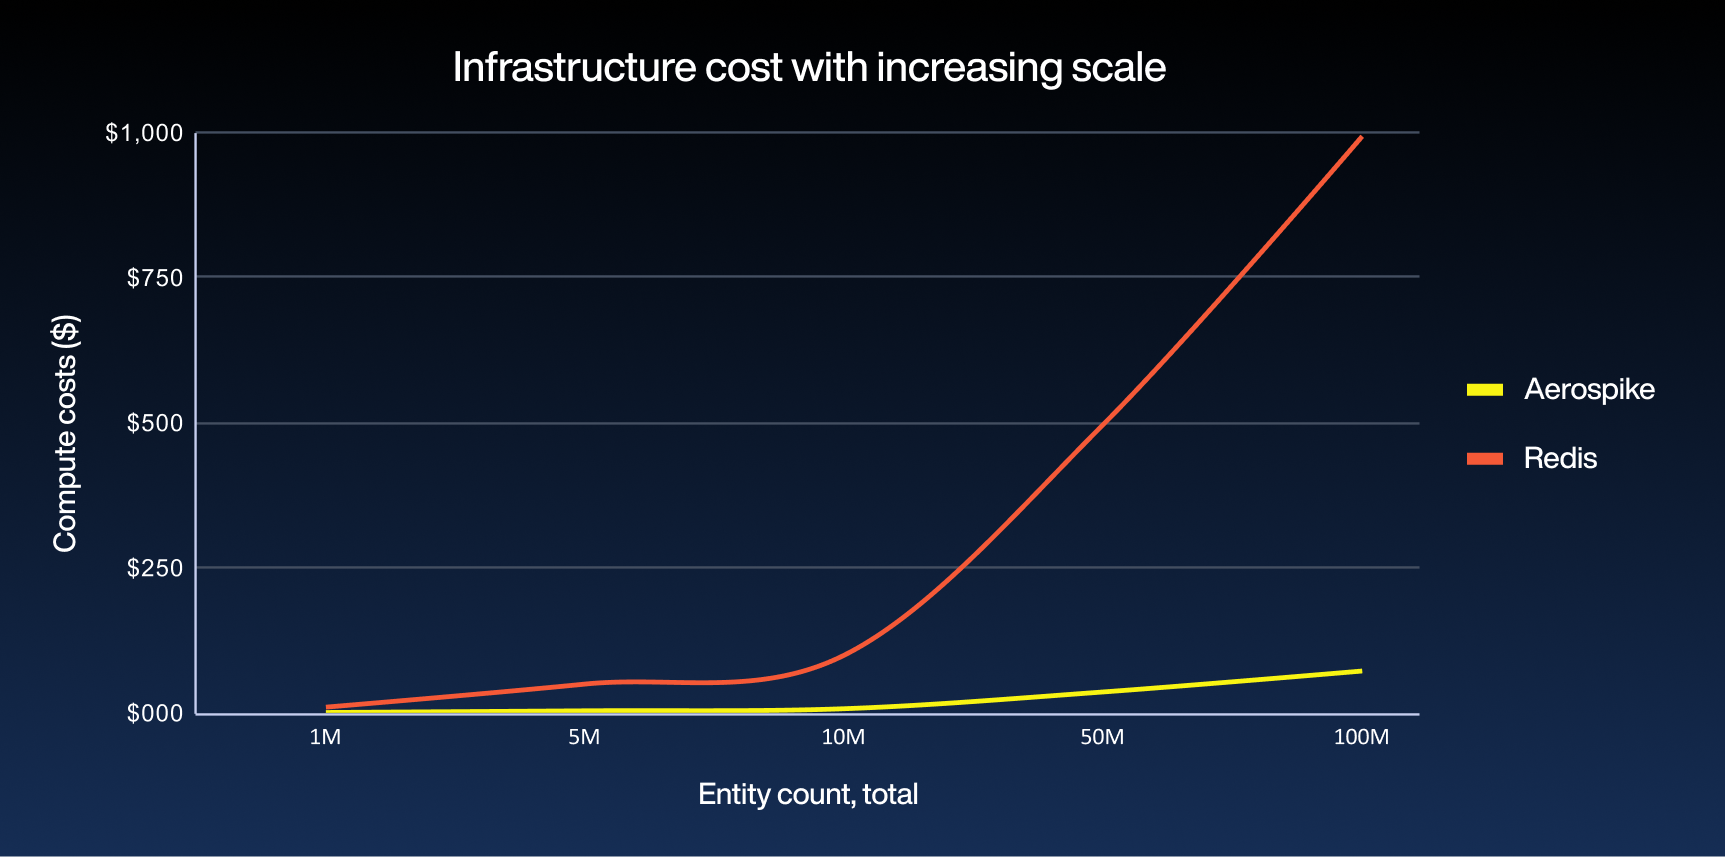
The gap widens as the dataset grows, which is what the chart above shows. These figures are illustrative rather than a cloud-provider quote, so use your own entity counts, prices, and latency targets for planning.
The difference grows as entity counts reach hundreds of millions or feature vectors become wider. It narrows when the entire working set is small enough to fit comfortably in RAM or when the workload requires every feature to have the lowest possible latency.
Lower infrastructure cost only helps if it still meets the latency target. The benchmark results show that SSD-based feature storage does in fact deliver near in-memory performance for these Feast workloads.
For teams using Feast, Aerospike provides an alternative that combines the performance of an in-memory architecture with the capacity and economics of SSD-based storage. For controlled, head-to-head benchmarks run under our own methodology, see Aerospike's competitive research, including a recent Redis comparison and DynamoDB results.
For production planning, use your own entity counts, feature widths, request rates, and latency targets. The right online store depends on the shape of your specific workload as well as the total size of your dataset.
Get started with the Aerospike online store for Feast here.
For a deeper understanding and more insights, explore these additional resources.
See more