Run and visualize queries
For the complete documentation index see: llms.txt
All documentation pages available in markdown.
This page shows you how to run Gremlin queries in G.V() and interpret the visual results. You will execute several queries from the Java and Python basics tutorials and see them rendered as interactive graph visualizations.
Visualize the entire graph
Start by viewing all vertices and edges in your transaction graph.
-
Enter the following query in the G.V() query editor.
g.V().limit(100)This query returns up to 100 vertices, which is sufficient for your sample dataset.
-
Execute the query.
Click the green play button in the toolbar to execute the query, or press Cmd+Enter (macOS) or Ctrl+Enter (Windows/Linux).
The Results tab displays JSON output showing the 10 vertices:
[ {"id" : -1011,"label" : "User","properties" : {"name" : "Alice","userId" : "U1","age" : 30}},...]Expected result (JSON) Verify: The status bar shows “Vertices: 10 Edges: 0” indicating 10 vertices were returned.
-
View the graph visualization.
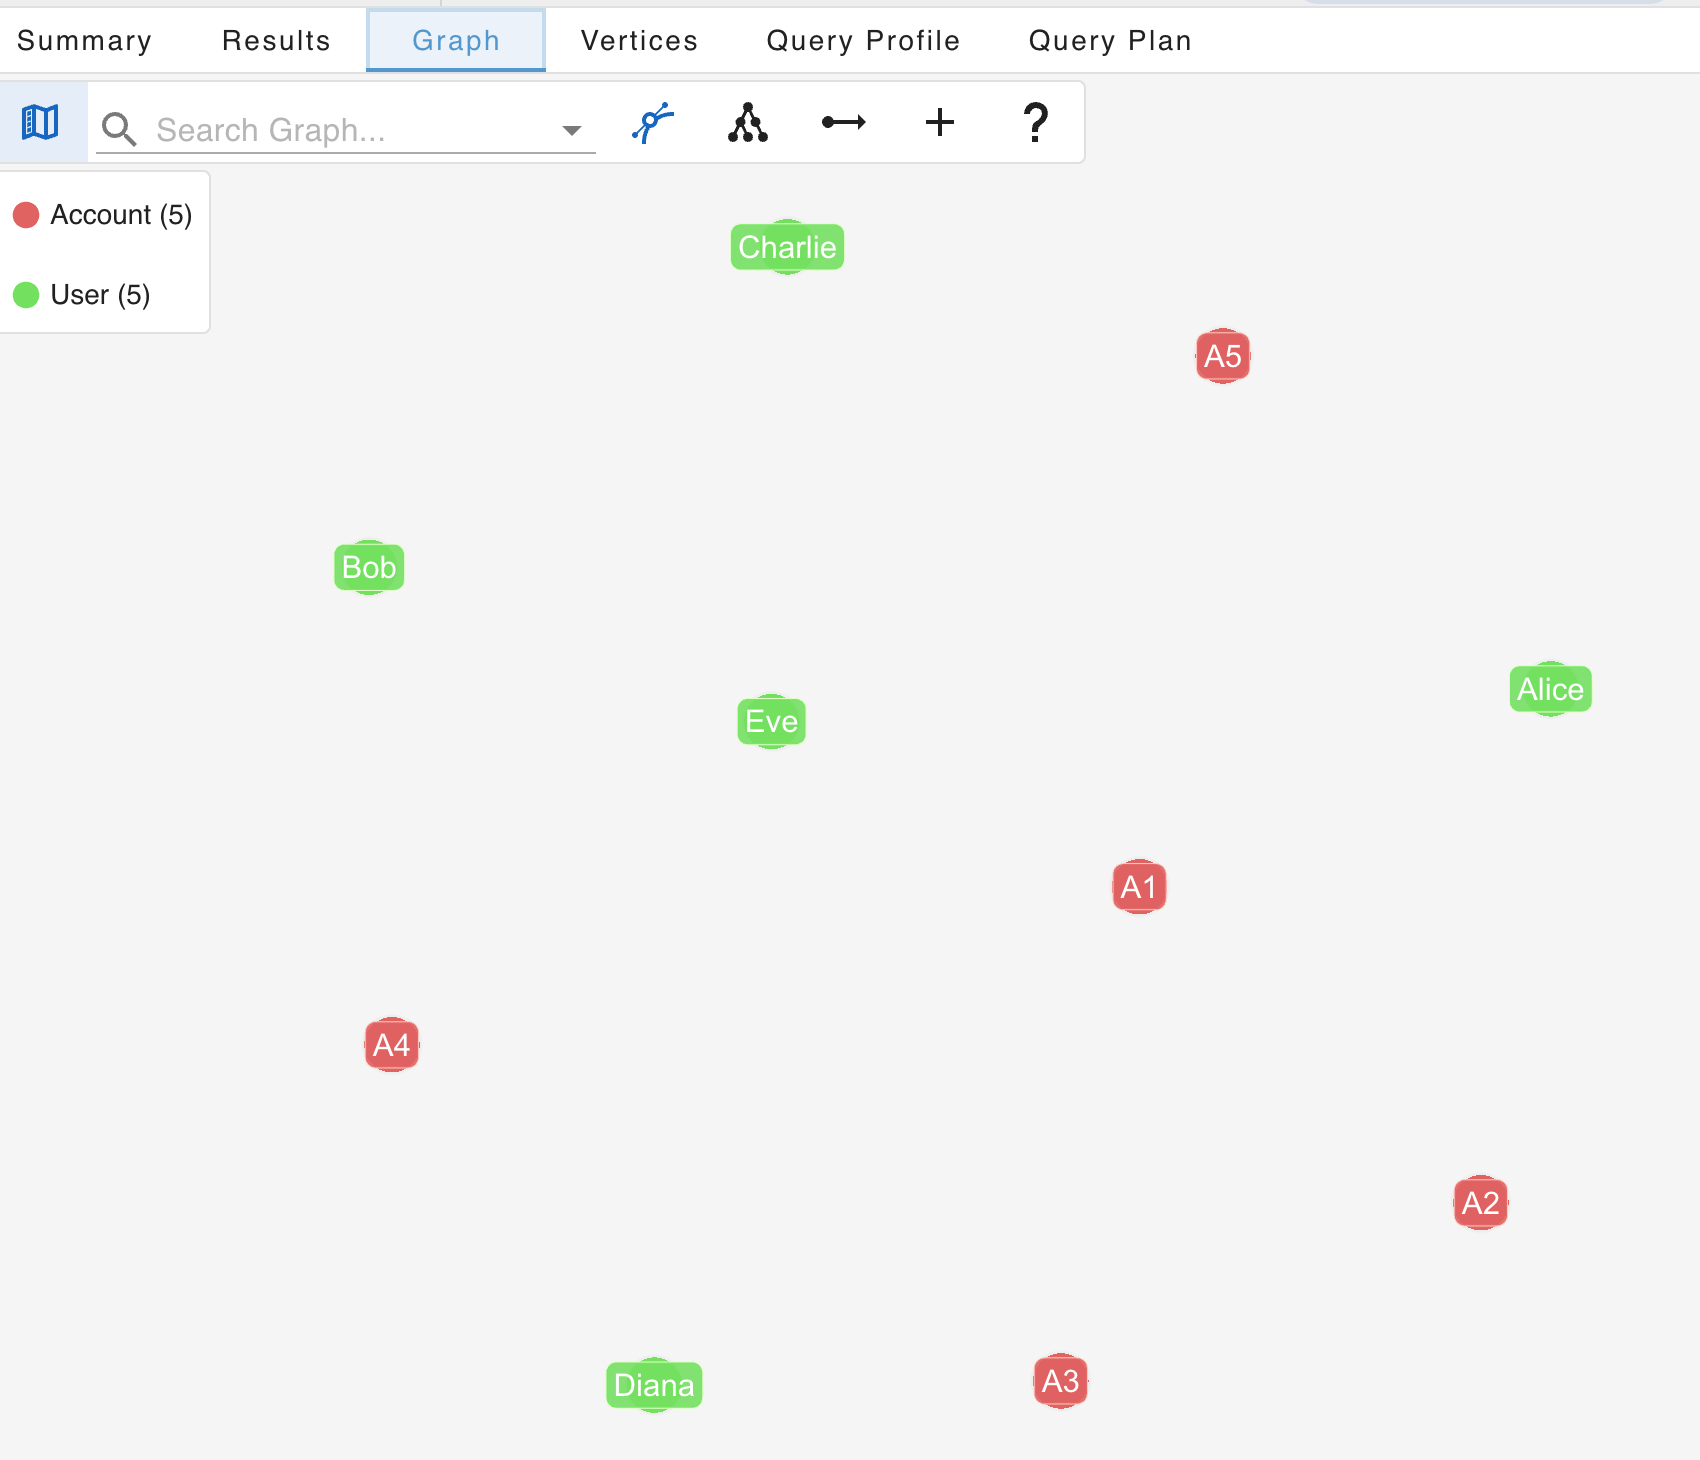
Click the Graph tab to see the vertices rendered as an interactive network diagram. You should see 5 User vertices (green) and 5 Account vertices (red) displayed on the canvas.
The sidebar shows a legend with vertex counts by label:
- Account (5)
- User (5)
-
Customize User vertex labels.
Open the Customize Graph Styles panel by clicking the palette icon in the Graph tab toolbar. In the VERTEX STYLES tab:
- Find the User row
- Click the Select a caption dropdown
- Select name to display user names on the vertices
Verify: User vertices now display names (Alice, Bob, Charlie, etc.) instead of the generic “User” label.
-
Customize owns edge labels.
In the Customize Graph Styles panel, click the EDGE STYLES tab:
- Find the owns row
- Click the Displaying dropdown
- Select Default (Edge Label) to show the edge label on the graph
Verify: The
ownsedges now display their label, making it clear which edges represent ownership relationships. -
Expand the graph to show edges.
Right-click on any vertex and select Load Edges > Load All Edges to fetch connected edges. Alternatively, run a query to get edges for a specific vertex:
g.V().has("Account", "accountId", "A1").bothE()Verify: The visualization now shows edges connecting the vertices. You should see
ownsedges linking a user to an account andTransactionedges between accounts.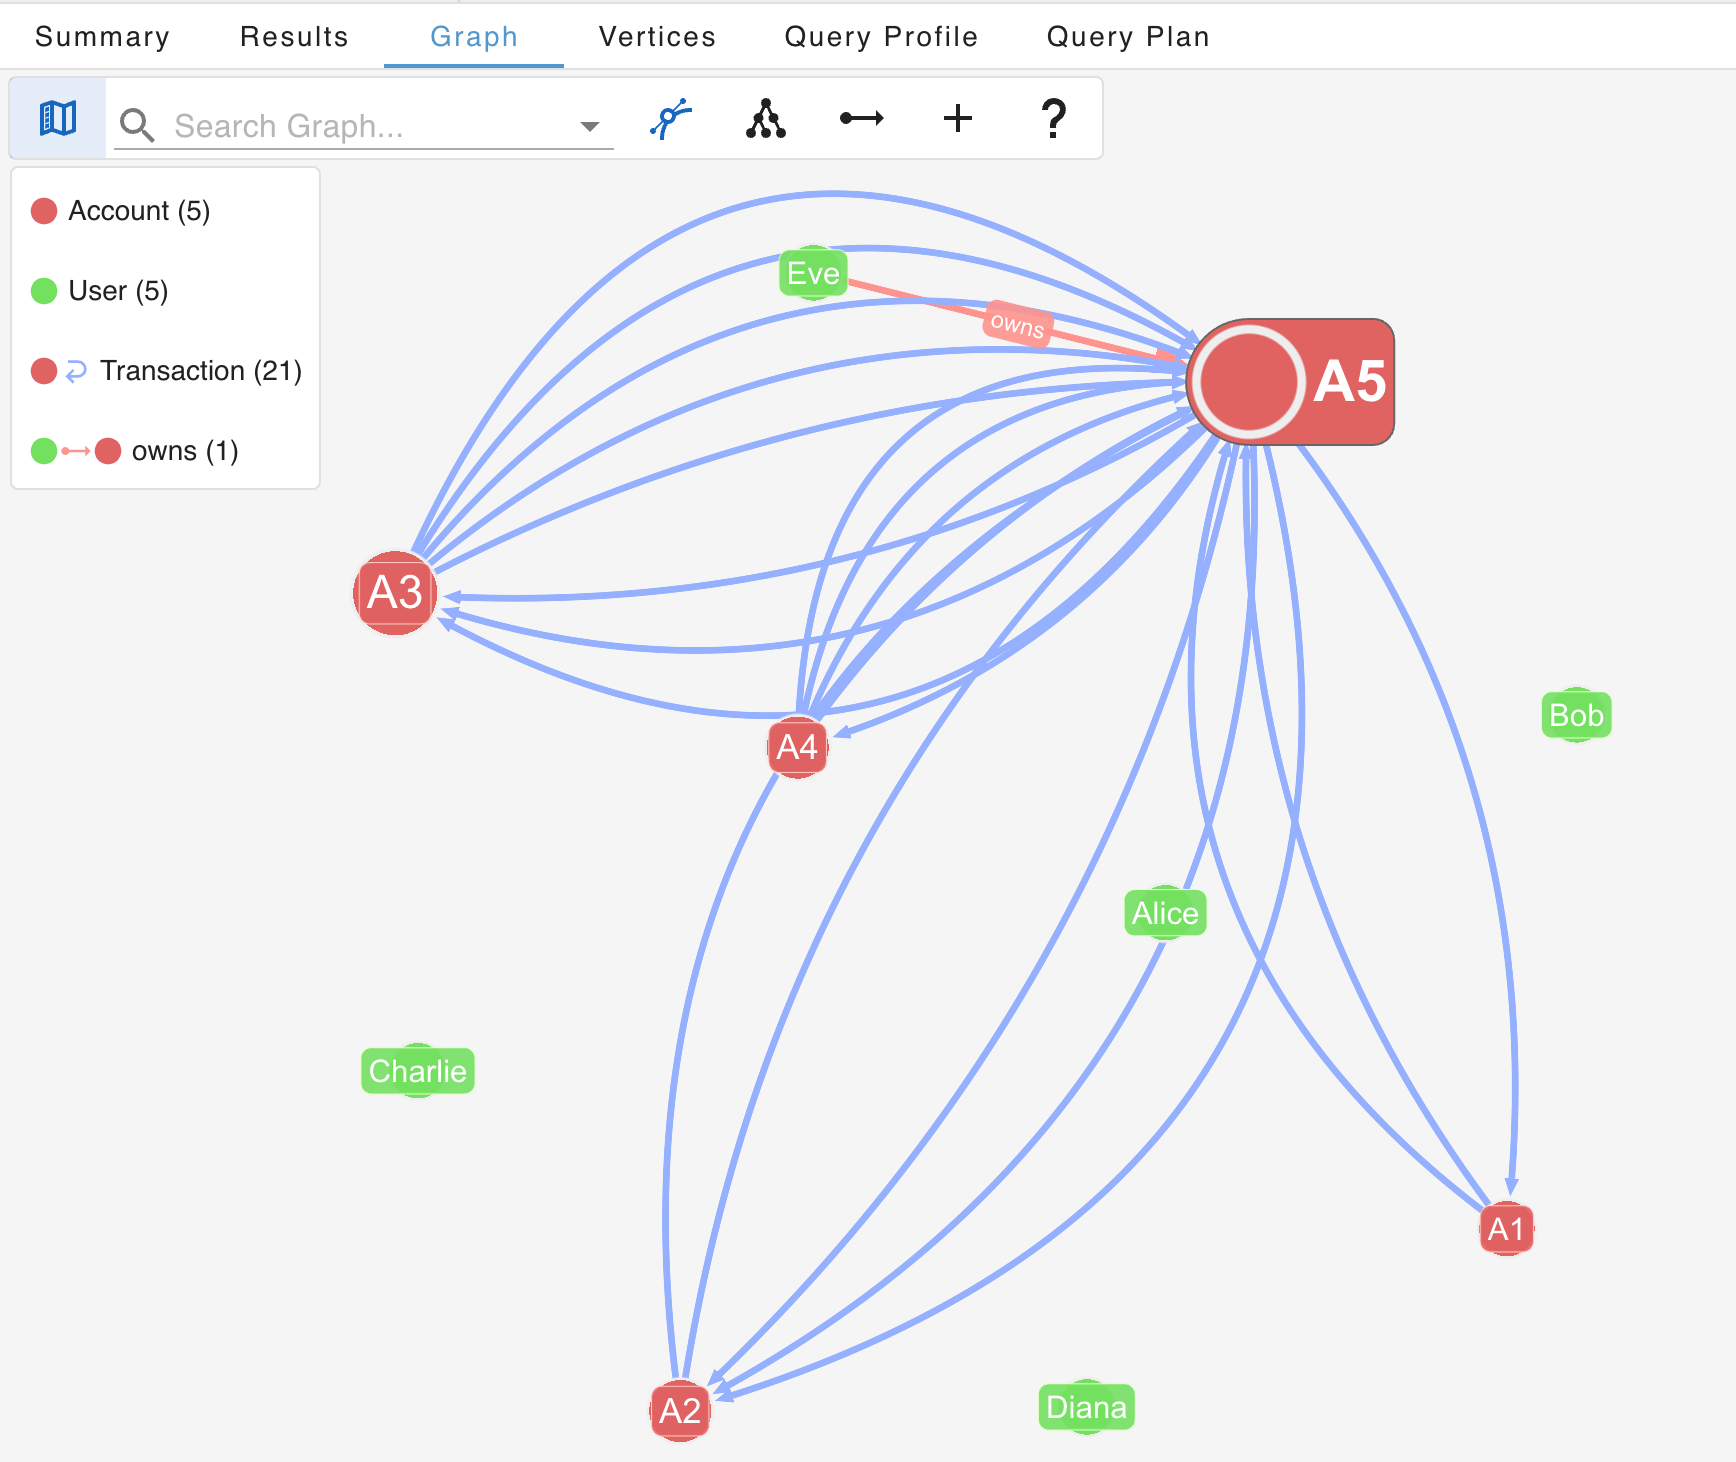


Understanding the visualization
G.V() represents graph elements with consistent visual conventions:
| Element | Representation |
|---|---|
| Vertices | Circles or nodes, colored by label |
| Edges | Lines connecting vertices, with arrows showing direction |
| Labels | Text near nodes showing the vertex or edge label |
The layout algorithm automatically positions nodes to minimize edge crossings. You can drag nodes to manually arrange them for clarity.
Inspecting properties
Click on any vertex or edge to view its properties in the properties panel:
- Vertices: Click on a User or Account to see properties like
name,userId,accountId, andbalance. - Edges: Click on a Transaction or
ownsedge to see properties liketransactionId,amount,type, andtimestamp.
Visualize transactions from a specific user
Explore Alice’s transaction network by starting from her vertex and expanding outward.
-
Query for Alice.
g.V().has("User", "name", "Alice") -
Execute the query.
Click the green play button in the toolbar to execute the query, or press Cmd+Enter (macOS) or Ctrl+Enter (Windows/Linux).
-
View the graph and expand connections.
Click the Graph tab to see Alice. Right-click on Alice and select Load Edges > Load All Edges to show her
ownsedge connecting to her account.Verify: Alice now connects to her Account (A1) via an
ownsedge.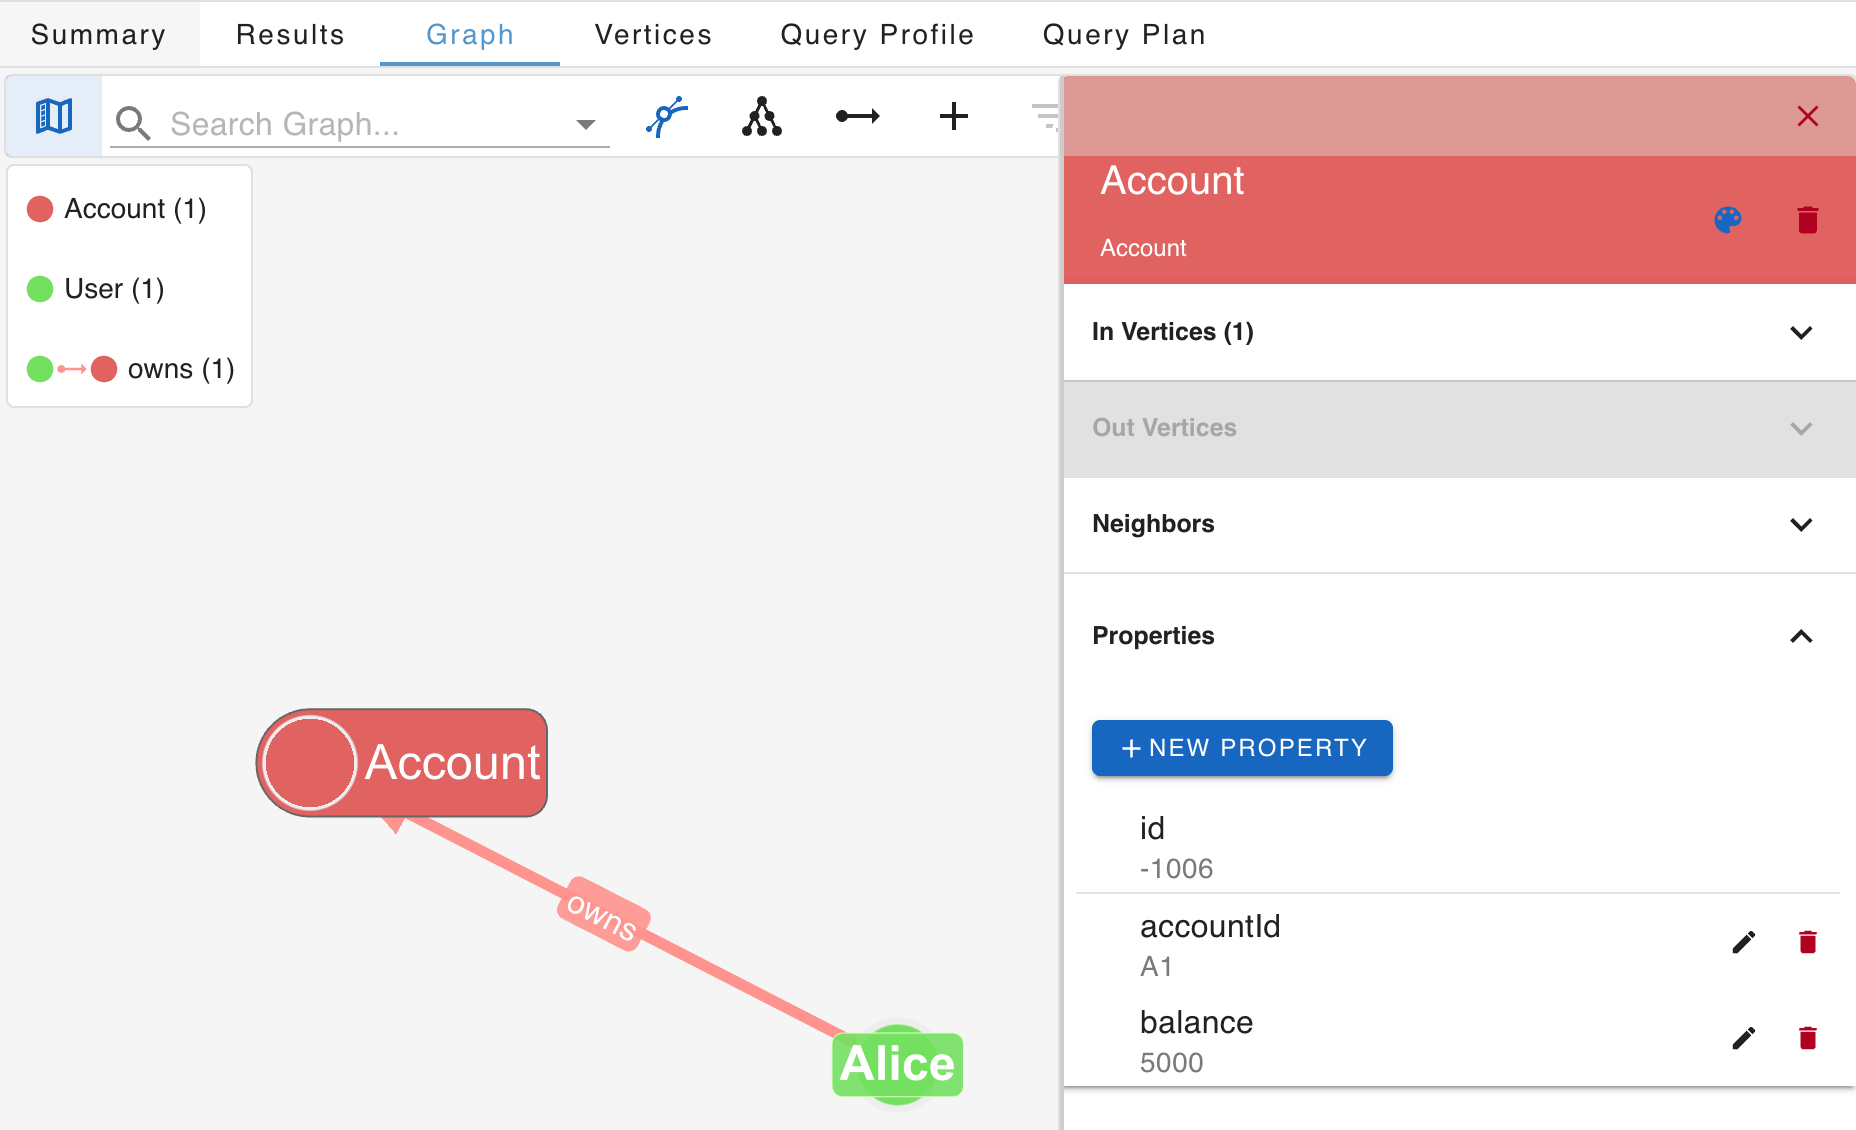
-
Expand Alice’s account to see transactions.
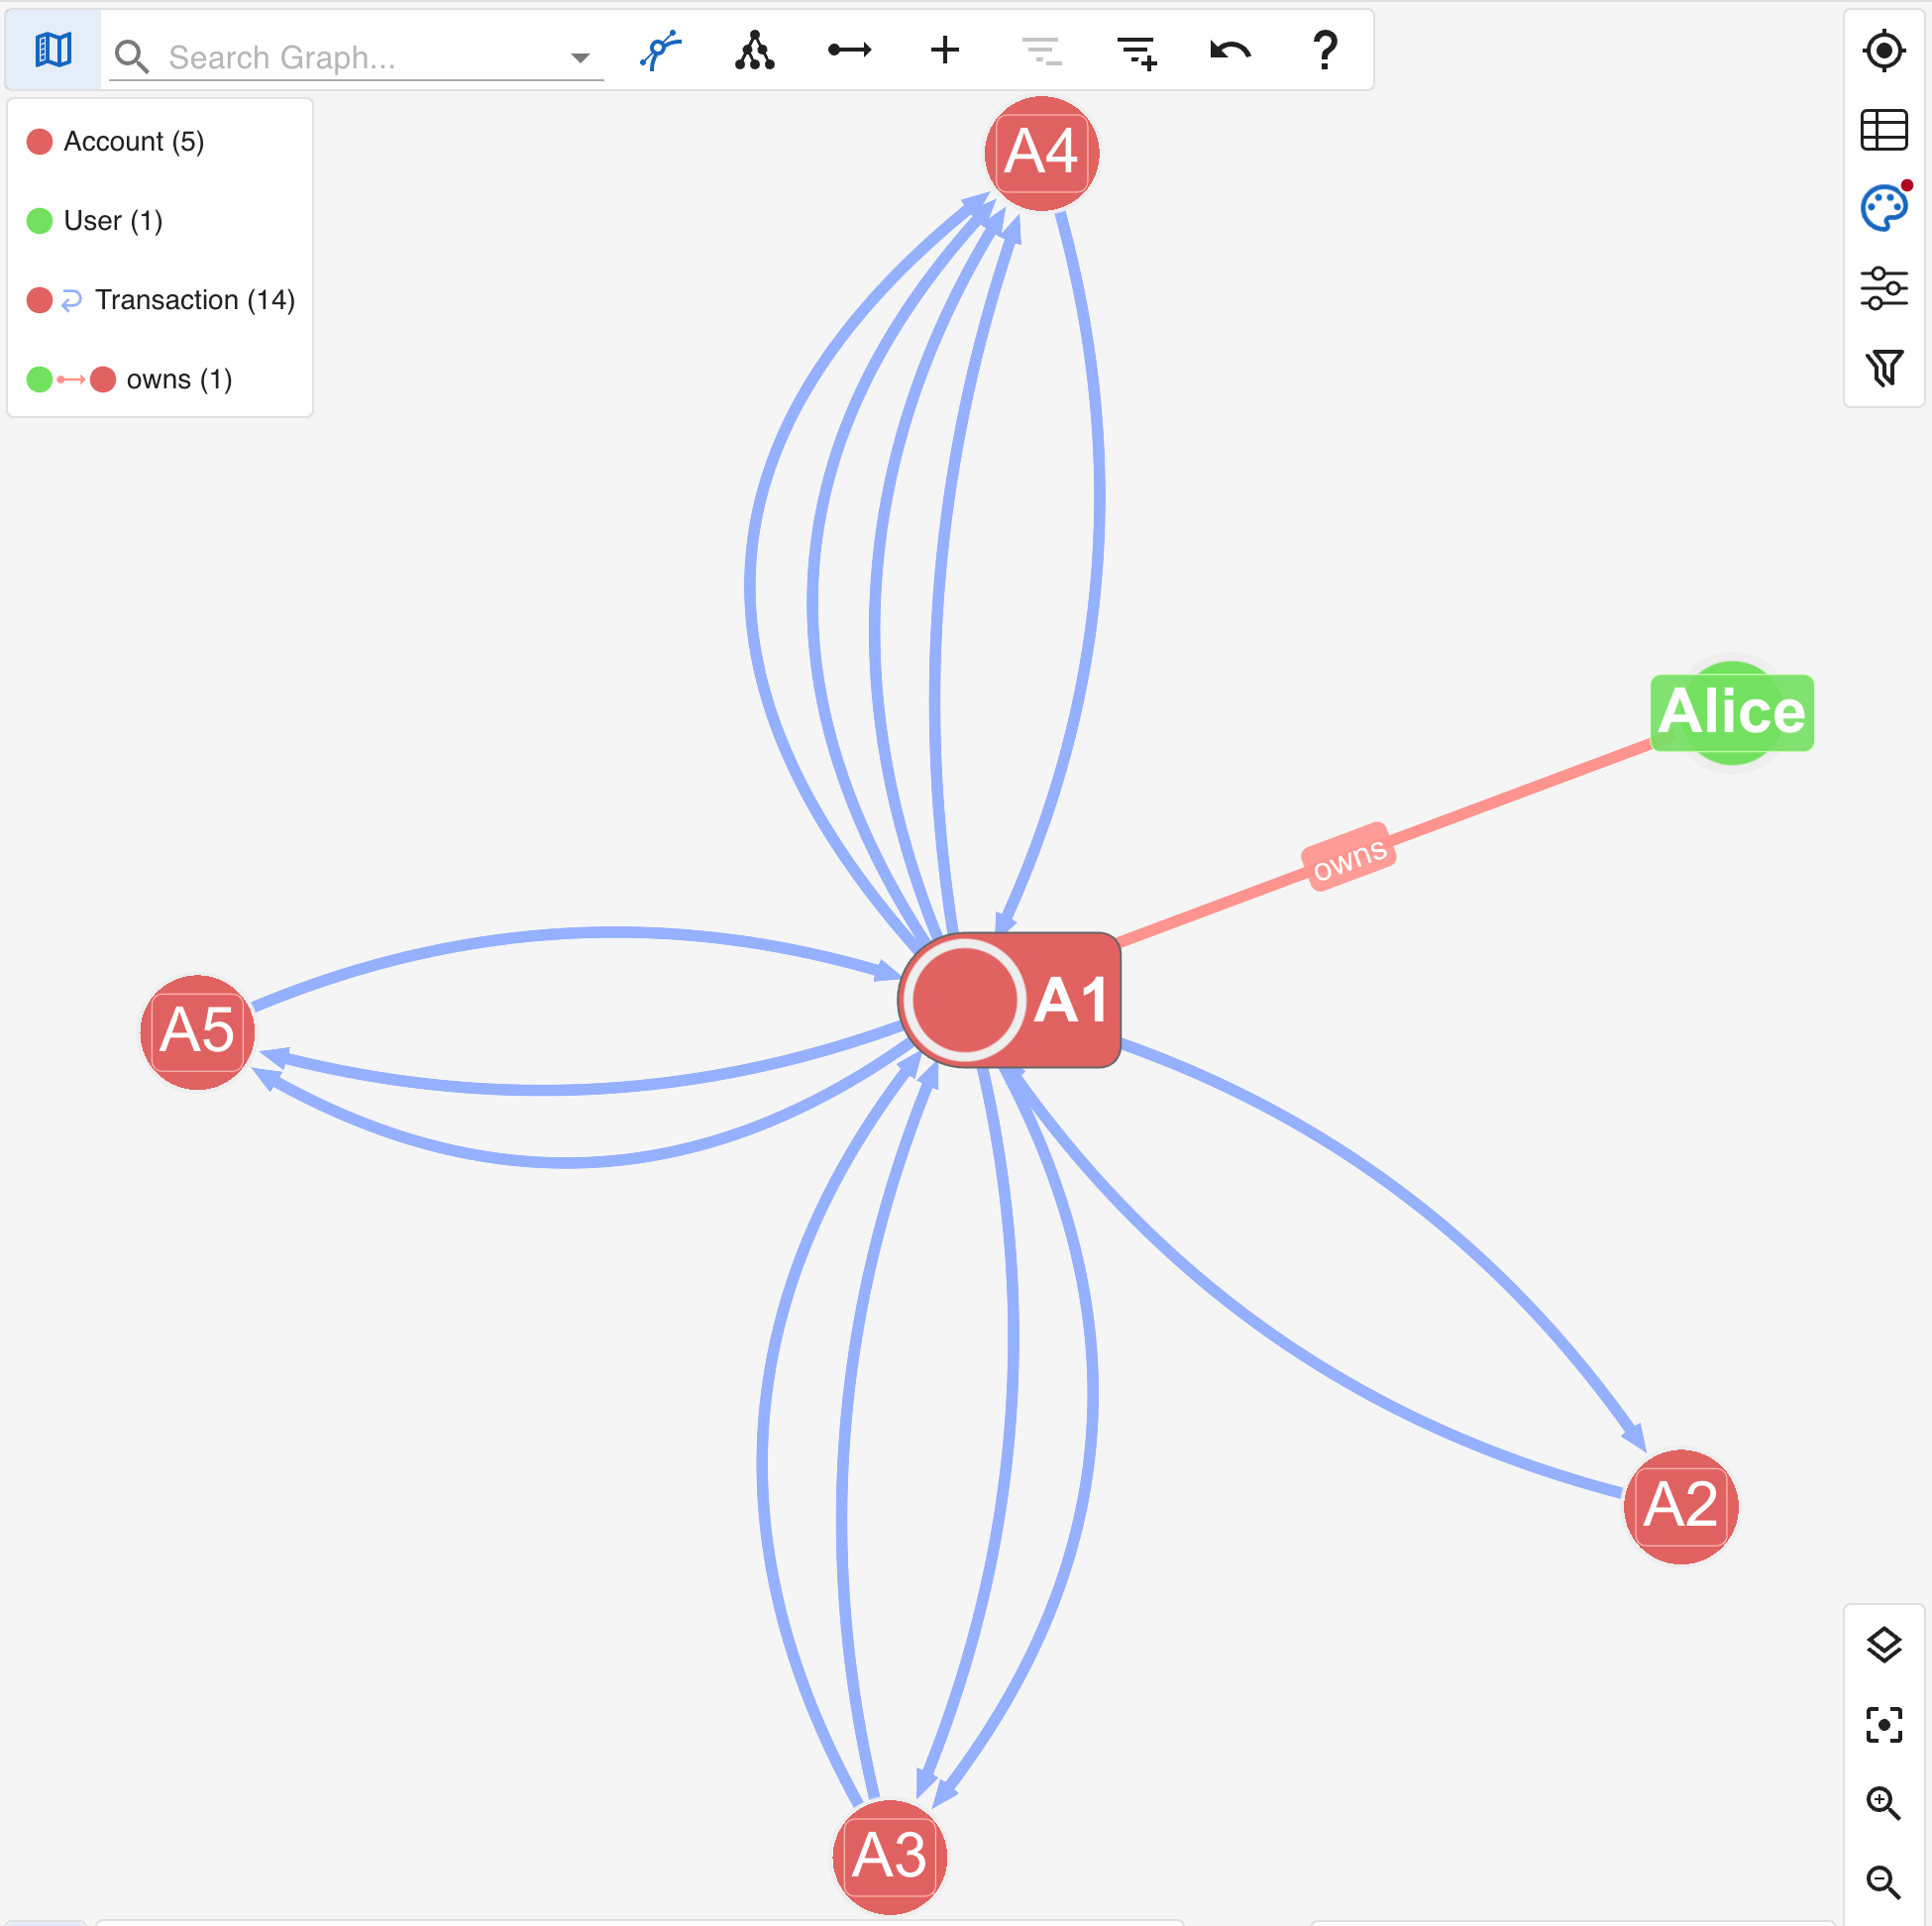
Right-click on Alice’s account (A1) and select Load Edges > Load All Edges to show all Transaction edges.
Verify: The visualization shows Transaction edges flowing to and from Alice’s account to other accounts.
-
Customize Account labels for clarity.
Open the Customize Graph Styles panel. In the VERTEX STYLES tab, find the Account row and set the caption to accountId.
Verify: Account vertices now display their IDs (A1, A2, A3, etc.) instead of the generic “Account” label.


Run aggregation queries
Aggregation queries return computed values rather than graph elements. G.V() displays these results in the Results tab as JSON.
-
Enter the aggregation query.
g.V().hasLabel("Account").group().by("accountId").by(outE("Transaction").values("amount").sum())This query groups accounts by their ID and sums the outgoing transaction amounts.
-
Execute the query.
Click the green play button in the toolbar to execute the query, or press Cmd+Enter (macOS) or Ctrl+Enter (Windows/Linux).
{"A1" : 4894,"A2" : 2656,"A3" : 4450,"A4" : 4695,"A5" : 7187}Expected result Verify: The Results tab displays a JSON map showing each account ID with its total outgoing transaction amount.