Monitoring stack components
For the complete documentation index see: llms.txt
All documentation pages available in markdown.
Aerospike’s monitoring stack extracts operational metrics from Aerospike Database clusters for visualization and analysis in Prometheus and Grafana. You can monitor Aerospike’s recommended list of metrics, or you can choose metrics from the Metrics Reference.
The Aerospike monitoring stack consists of two component layers:
- Components that monitor and alert
- Components that visualize data or receive alerts
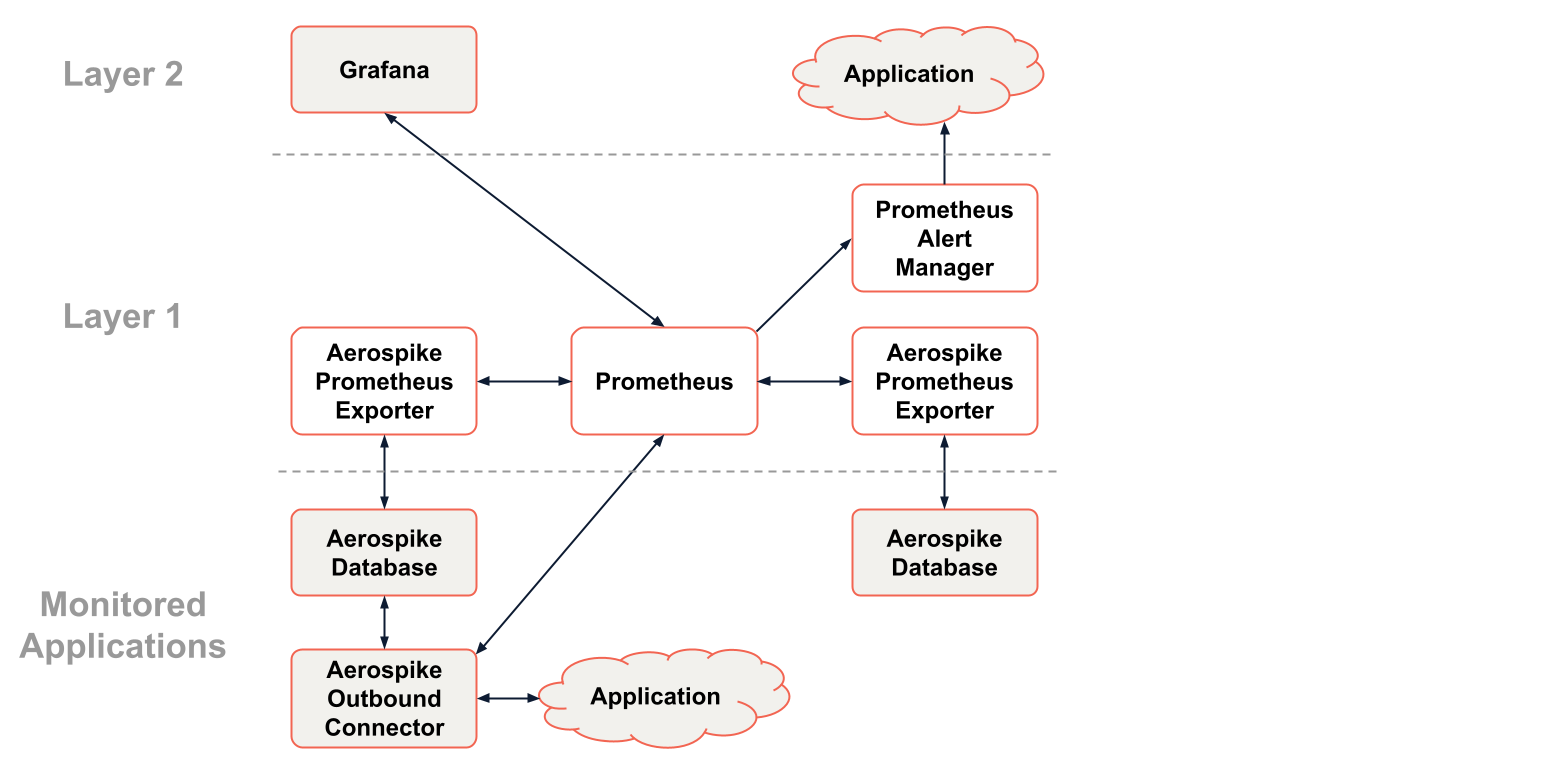
The following image illustrates the Aerospike monitoring stack, monitoring two Aerospike databases and an outbound connector.

Figure 1: Monitoring stack topology
Monitored applications
Below the stack, the diagram shows the applications that you can monitor: Aerospike Database Enterprise Edition and Aerospike outbound connectors.
Aerospike Database Enterprise Edition
You can monitor Aerospike’s recommended list of metrics, or you can choose metrics from the Metrics Reference.
Aerospike outbound connectors
Aerospike provides these connectors that receive change-notification messages from Aerospike Database Enterprise Edition, convert them, and send them to messaging and streaming platforms:
- Aerospike Connect for JMS - Outbound
- Aerospike Connect for ESP - Outbound
- Aerospike Connect for Kafka - Outbound
- Aerospike Connect for Google Pub/Sub (Beta) - Outbound
- Aerospike Connect for Pulsar - Outbound
You can monitor these connectors in Prometheus without the use of the Aerospike Prometheus Exporter. You can select metrics to monitor or import dashboards into Grafana that are configured with a set of metrics. For more information about the metrics and the dashboards, see “Prometheus Integration” in the Aerospike Connect section of the Aerospike documentation.
Layer 1: Components that monitor and alert
This layer includes the components that monitor an Aerospike database or outbound connector.
Aerospike Prometheus Exporter
Aerospike Prometheus Exporter extracts specified metrics from an instance of Aerospike Database Enterprise Edition when requested to do so by Prometheus.
Prometheus
Prometheus is an open-source, time-series database and alerting system. A single Prometheus database can store metrics from multiple Aerospike databases at the same time.
Prometheus connects to the Prometheus Exporter at regular intervals to request metrics. In turn, Prometheus Exporter connects to Aerospike and gathers the required metrics, which are then returned to Prometheus. This happens at an interval preconfigured in Prometheus (scrape interval). The metrics are stored in a time-series database in Prometheus.
Prometheus Alert Manager
The service receives alert information from Prometheus and pushes the alerts to third-party applications, such as Slack.
Layer 2: Components that visualize data or receive alerts
This layer receives information from Prometheus.
Grafana
Grafana is an open-source analytics and monitoring solution. In the Aerospike monitoring stack, Grafana presents dashboards with analytics for Aerospike databases. The metrics Grafana uses to generate the visualizations is queried from the Prometheus database. A single Grafana instance can present metrics from multiple instances of Aerospike Database Enterprise Edition.