Install components separately
This page describes how to do individual installs of the Aerospike monitoring stack components.
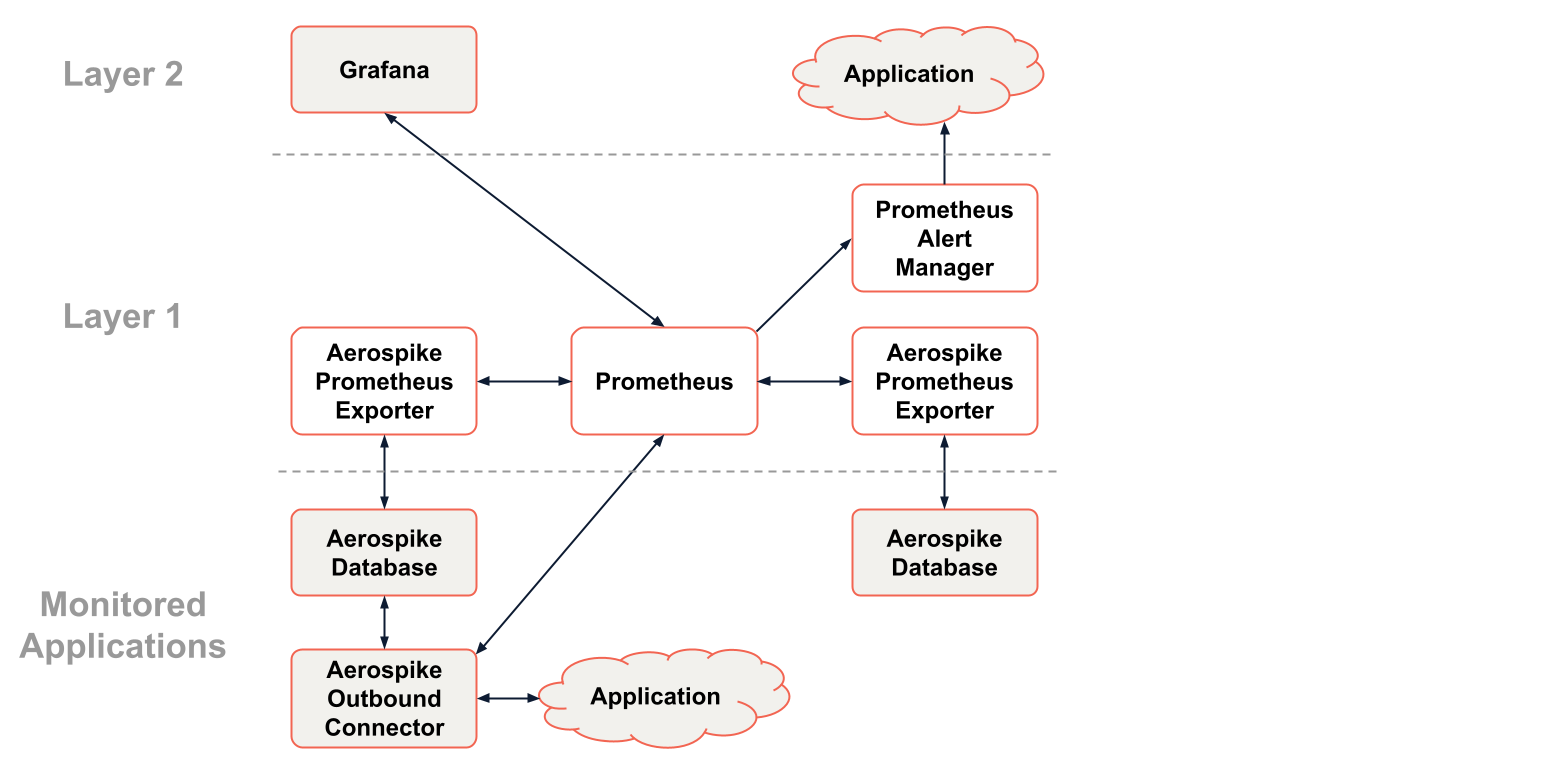
The following diagram is an example of the Aerospike monitoring stack. It shows the monitoring of two Aerospike databases and an outbound connector.

Figure 1: Aerospike monitoring topology
Prerequisites
If the components that you want to monitor are already deployed, then skip to step 2. Otherwise, follow one or both of these steps, depending on your use case:
- Deploy one or more instances of Aerospike Database Enterprise Edition. For instructions about deploying an Aerospike database, see “System Overview”.
- Install one or more instances of an Aerospike outbound connector. For instructions about deploying outbound connectors, see Streaming from Aerospike.
Install the components of Layer 1
Install an instance of Aerospike Prometheus Exporter for each Aerospike database that you want to monitor.
You can download and install Aerospike Prometheus Exporter from a package, or you can clone the GitHub repository and compile from source.
- Instructions for downloading and installing from a package
- GitHub repository and instructions for compiling source files
Install Prometheus
See the page “Installation” in the Prometheus documentation.
If you want to send alerts from Prometheus, install Prometheus Alert Manager.
Instructions are in this component’s GitHub repository.
Install Grafana as Layer 2
See the page “Install Grafana” in the Grafana documentation.